
 Adrienne Jill B. Valdez
For e-commerce businesses, revenue alone does not always reflect the overall financial health of the business. A store can generate strong sales and still struggle with profitability if product costs, shipping, transaction fees, and other variable expenses consume a significant portion of each sale.
This is where contribution margin becomes important. It helps businesses understand how much revenue remains after variable costs are deducted, providing a clearer picture of which products, sales channels, and marketing efforts support e-commerce profitability rather than simply increasing sales. In the sections that follow, we’ll explain what contribution margin is, how it differs from gross profit, how to calculate it, and how it can be used to support better marketing decisions.
What is Contribution Margin?
Contribution margin is a financial metric that measures the amount of revenue remaining after deducting all variable costs associated with producing and selling a product or service.
According to Investopedia, contribution margin helps businesses determine how much of each sale contributes toward covering fixed expenses before generating profit. Unlike revenue, which only reflects total sales, contribution margin focuses on the profitability of each sale by considering only the costs that change with sales volume.
For e-commerce businesses, understanding contribution margin is essential because it provides a clearer measure of product profitability than revenue alone, enabling better pricing, cost analysis, and marketing decisions.
Contribution Margin vs Gross Profit
Although contribution margin and gross profit are both used to evaluate profitability, they measure different aspects of a business’s financial performance.
Gross Profit measures the amount of revenue remaining after subtracting the cost of goods sold (COGS), such as the direct costs of manufacturing or purchasing products. It provides a broad indication of how efficiently a business produces or sources its products.
In contrast, Contribution Margin considers all variable costs associated with generating a sale. These costs may include shipping fees, payment processing charges, packaging expenses, discounts, and refunds.
By accounting for the costs directly associated with each transaction, contribution margin provides a more comprehensive view of product profitability and the amount available to cover fixed operating expenses and generate profit.
Businesses can further strengthen these insights through sales and operational analysis, which helps identify trends, evaluate product performance, optimize pricing strategies , and uncover opportunities to improve profitability.
Step-by-Step Contribution Margin Calculation for E-Commerce
Now that we’ve distinguished contribution margin from gross profit, the next step is learning how to calculate it. The calculation is straightforward and requires only three key components: revenue, total variable costs, and the contribution margin formula.
Step 1. Determine Total Revenue
Start by identifying the total revenue generated from product sales during the selected period.
Revenue refers to the total earnings a business generates over a specific timeframe through the production and delivery of goods or services before deducting any business expenses. For e-commerce businesses, this typically includes all completed customer purchases before accounting for shipping costs, discounts, refunds, or transaction fees.
Step 2. Calculate Total Variable Costs
Next, identify and calculate all variable costs associated with generating sales. Variable costs change in proportion to the number of products sold, meaning they increase or decrease as sales volume changes.
Common variable costs for e-commerce businesses include:
- Cost of Goods Sold (COGS)
- Shipping and fulfillment costs
- Payment processing fees
- Packaging materials
- Sales discounts
- Customer refunds
Including all relevant variable costs ensures that contribution margin accurately reflects the profitability of each sale.
Step 3. Apply the Contribution Margin Formula
Now that you have your total revenue and variable costs, apply the contribution margin formula to evaluate your profitability:
Contribution Margin = Revenue – Total Variable Costs
The resulting amount represents the revenue remaining after covering all variable costs. This remaining amount can then be used to pay fixed operating expenses such as rent, salaries, software subscriptions, and advertising before contributing to profit
Contribution Margin Example in E-Commerce Business (Python Implementation)
After understanding the contribution margin formula, let’s apply it using Python. In real-world e-commerce businesses, analysts typically work with transaction datasets rather than calculating contribution margin manually for each sale. Python makes it possible to automate these calculations, analyze large volumes of data efficiently, and generate insights that support business decision-making.
For this example, we’ll use a sample e-commerce transaction dataset containing 100 sales records. Each transaction includes revenue and several variable cost components commonly incurred by online businesses, such as advertising spend, cost of goods sold (COGS), fulfillment costs, shipping costs, payment processing fees, discounts, and refunds.
Although operating expenses and advertising spend are included in the dataset, they will not be included in the contribution margin calculation because contribution margin only considers variable costs.
Step 1. Open Python or Google Colab
Begin by opening your preferred Python environment. For this tutorial, we’ll use Google Colab, a cloud-based notebook that allows you to write and execute Python code directly from your browser without installing additional software.
Step 2. Import the Required Library
Begin by importing the pandas library, which will be used to load and manipulate the dataset.
Python

import pandas as pdStep 3. Upload and Load the Dataset
Since this tutorial uses Google Colab, upload the CSV file containing the sample e-commerce transactions.
Python

from google.colab import files

uploaded = files.upload()

After uploading the file, load it into a pandas DataFrame.
Python

# Load the dataset
df = pd.read_csv("e-commerce_sample_dataset.csv")Step 4. Preview the Dataset
Before performing any calculations, inspect the dataset to verify that it has been loaded correctly.
Python

# Dataset preview
df.head()
Interpretation: The dataset contains one row for each e-commerce transaction. Each record includes revenue, advertising spend, cost of goods sold (COGS), fulfillment costs, shipping costs, payment processing fees, discounts, refunds, and operating expenses. These variables provide the information required to calculate contribution margin.
Step 5. Perform a Basic Data Quality Assessment
Before calculating financial metrics, analysts should verify that the dataset is complete and properly structured. Basic data quality checks help identify issues that could affect the accuracy of the analysis.
Inspect the dataset structure
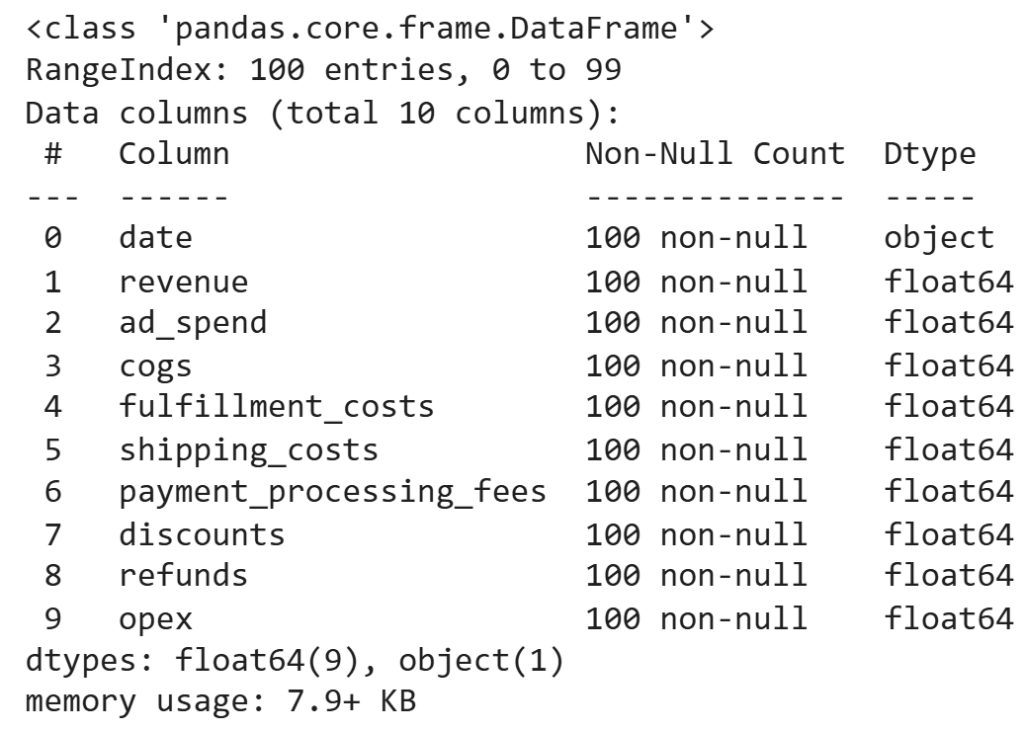
The output confirms that each variable has the expected data type and that the dataset contains 100 observations.
Check for missing values
Python

# check missing values

df.isnull().sum()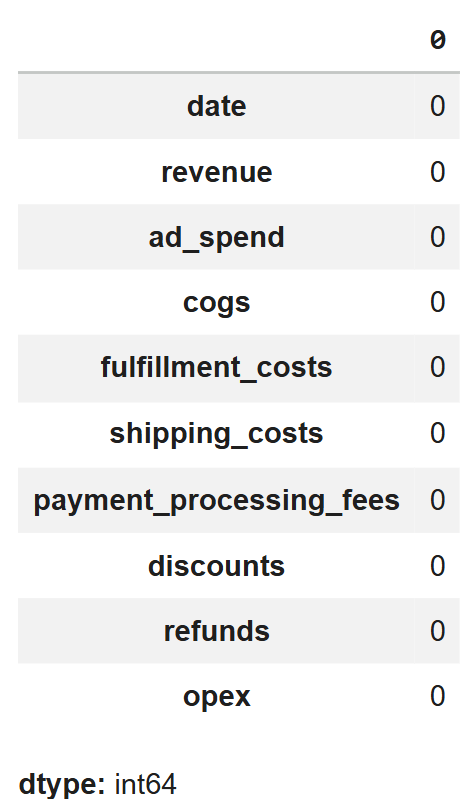
Interpretation: The dataset contains no missing values across the revenue and cost variables. Since contribution margin calculations rely on complete financial information, verifying data completeness helps ensure accurate results.
Generate summary statistics
Python

#summary statistics

df.describe()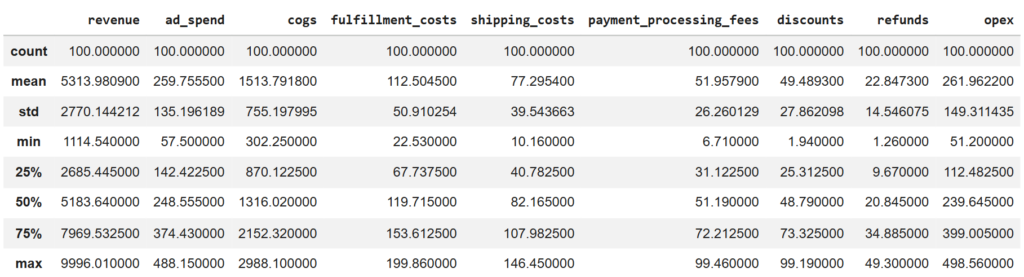
Interpretation: The summary statistics provide an overview of the distribution of revenue and cost variables, allowing analysts to verify that the values fall within reasonable ranges before proceeding with the analysis.
Step 6. Calculate Total Variable Costs
Next, we need to combine all variable cost components into a single value for each transaction. Since contribution margin accounts for every variable expense tied to a sale, the following code groups them into a single variable.
Python

# Calculate variable costs by summing up all relevant cost components
df["variable_costs"] = (
    df["cogs"] +
    df["fulfillment_costs"] +
    df["shipping_costs"] +
    df["payment_processing_fees"] +
    df["discounts"] +
    df["refunds"]
)Display the updated dataset.
Python

# Display the first few rows of the 'revenue' and 'variable_costs' columns
df[
    [
        "revenue",
        "variable_costs"
    ]
].head()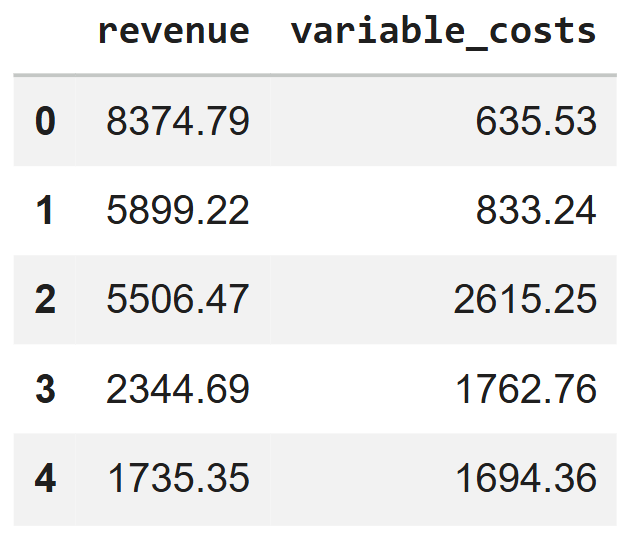
Interpretation: The newly created variable_costs column represents the combined variable costs for each transaction. These costs fluctuate with sales volume and form the basis for calculating contribution margin.
Step 7. Calculate Contribution Margin
With the total variable costs computed, contribution margin can now be calculated by subtracting total variable costs from revenue.
Python

# Calculate the contribution margin by subtracting variable costs from revenue
df["contribution_margin"] = (
    df["revenue"] -
    df["variable_costs"]
)Display the results.
Python

#display the results
df[
    [
        "revenue",
        "variable_costs",
        "contribution_margin"
    ]
].head()
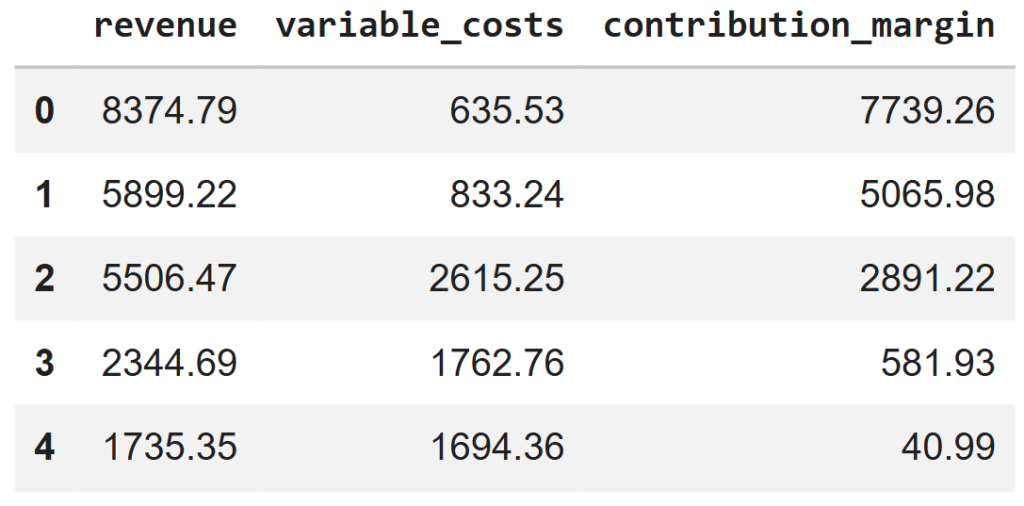
Interpretation: Each value in the contribution_margin column represents the amount remaining after all variable costs have been deducted from revenue. This amount is available to cover fixed operating expenses before contributing to profit.
Calculate the Contribution Margin Ratio
To express contribution margin as a percentage of revenue, calculate the contribution margin ratio.
Python

# Calculate the Contribution Margin Ratio (CM Ratio) as a percentage
df["cm_ratio"] = (
    df["contribution_margin"] /
    df["revenue"]
) * 100Display the calculated values.
Python

# Display the first few rows of 'revenue', 'contribution_margin', and 'cm_ratio'
df[
    [
        "revenue",
        "contribution_margin",
        "cm_ratio"
    ]
].head()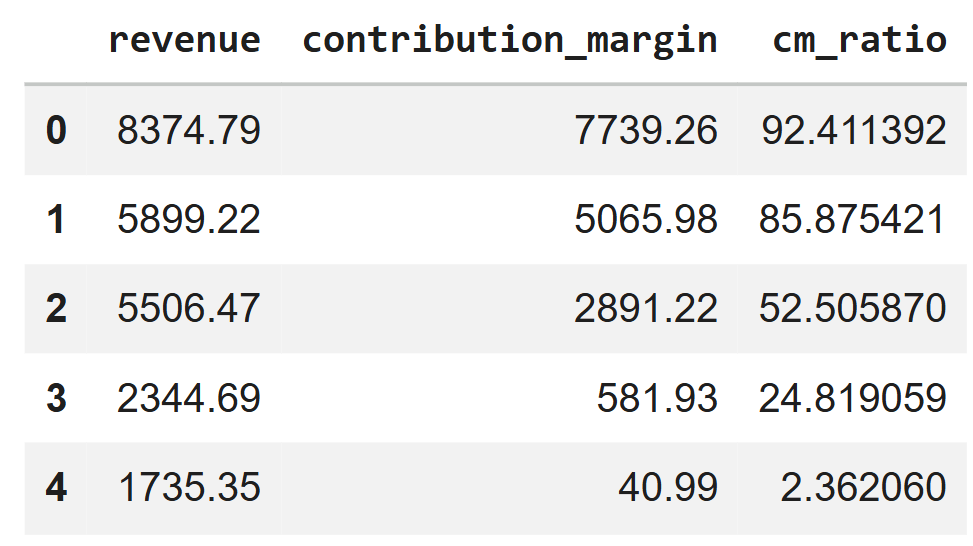
Interpretation: The contribution margin ratio indicates the percentage of revenue remaining after variable costs have been deducted. This metric allows businesses to compare the profitability of products, sales channels, or marketing campaigns regardless of differences in sales volume.
Step 8. Display the Final Results
Finally, display the complete set of calculated metrics.
Python

df[
    [
        "date",
        "revenue",
        "variable_costs",
        "contribution_margin",
        "cm_ratio"
    ]
].head(10)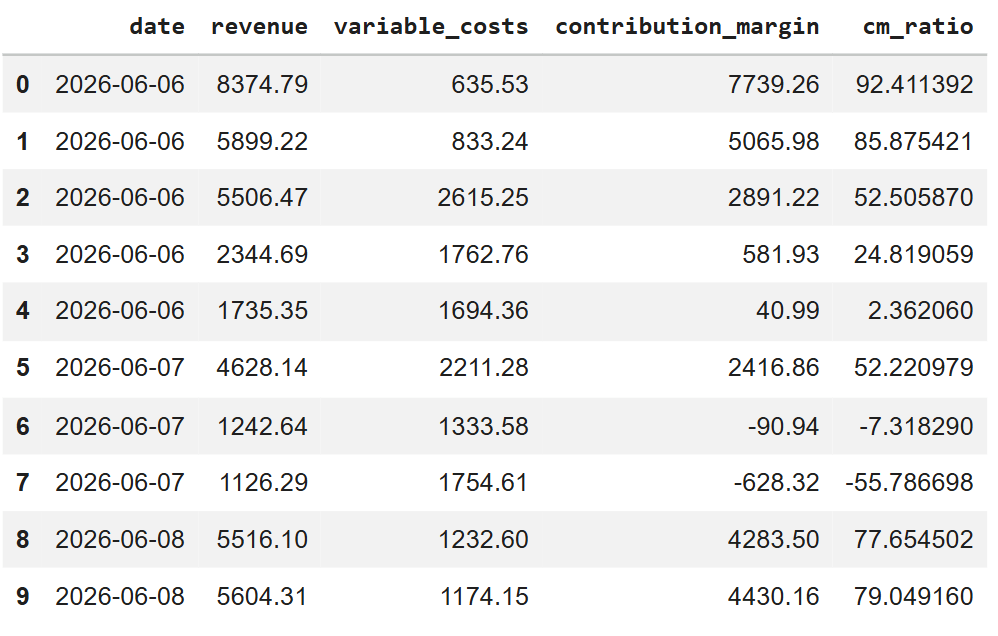
Interpretation: The final output combines the original revenue values with the calculated variable costs, contribution margin, and contribution margin ratio. These metrics enable analysts to identify profitable transactions, compare product performance, and support pricing and marketing decisions using data.
While the numerical results provide valuable information, visualizing the data makes it easier to identify profitability patterns and relationships that may not be immediately apparent from tables alone. Through profitability analysis, businesses can evaluate how contribution margin changes with revenue and use these insights to support more informed financial and operational decisions.
Visualize the Results
While tabular data provides the exact numerical values, visualizations help reveal patterns that may not be immediately apparent. The following scatter plot illustrates the relationship between revenue and contribution margin across all transactions. A trend line is included to highlight the overall direction of the relationship.
Python

# This cell generates a scatter plot to visualize the relationship between 'revenue' and 'contribution_margin'.
import numpy as np
import matplotlib.pyplot as plt

plt.figure(figsize=(8,6))

plt.scatter(
    df["revenue"],
    df["contribution_margin"],
    alpha=0.7,
    label="Transactions"
)

# Regression line
m, b = np.polyfit(df["revenue"], df["contribution_margin"], 1)

plt.plot(
    df["revenue"],
    m*df["revenue"] + b,
    linewidth=2,
    label="Trend"
)

plt.title("Revenue vs. Contribution Margin")
plt.xlabel("Revenue")
plt.ylabel("Contribution Margin")

plt.legend()
plt.grid(True)

from matplotlib.ticker import FuncFormatter

currency = FuncFormatter(lambda x, pos: f'₱{x:,.0f}')

plt.gca().xaxis.set_major_formatter(currency)
plt.gca().yaxis.set_major_formatter(currency)

plt.show()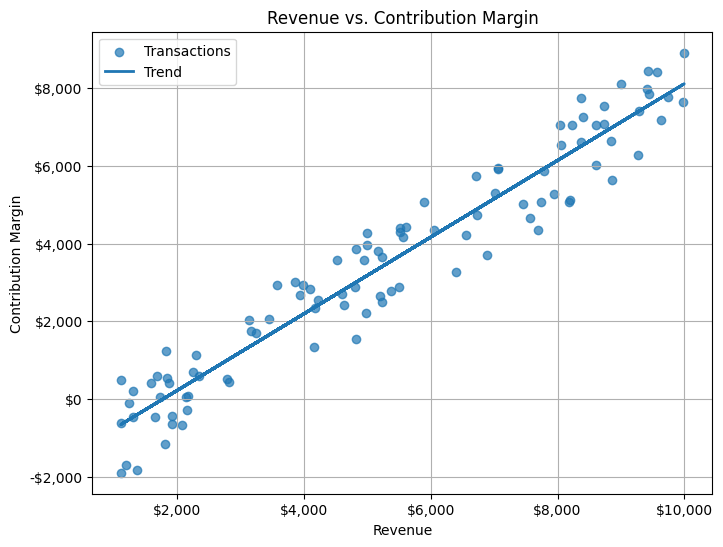
Interpretation: The scatter plot illustrates a positive relationship between revenue and contribution margin across all transactions, as shown by the upward-sloping trend line. While higher-revenue transactions generally produce higher contribution margins, the relationship is not perfectly consistent because variable costs differ from one sale to another.
Notably, several transactions have negative contribution margins, indicating that their variable costs exceeded the revenue generated. This reinforces the importance of evaluating contribution margin alongside revenue, as strong sales alone do not always translate into profitability.
How Advertising Spend Affects Contribution Margin
Advertising spend refers to the amount of money a business invests in paid promotional activities to increase brand awareness, attract customers, and drive sales. This includes expenditures on digital advertising platforms such as Google Ads, Meta Ads, social media campaigns, display advertising, and other paid marketing channels.
From an accounting perspective, advertising is generally classified as an operating expense rather than part of the cost of goods sold or other variable costs.
Unlike shipping costs, payment processing fees, or discounts, advertising spend is not deducted when calculating contribution margin. Instead, contribution margin represents the amount of revenue remaining after variable costs have been covered.
This remaining contribution is then used to pay fixed operating expenses—including advertising—before generating profit. Consequently, contribution margin indicates how much financial capacity a business has to support its marketing activities while remaining profitable.
This distinction is especially important to e-commerce businesses. Increased advertising budgets may result in higher sales, but additional revenue does not always equate to higher profitability if contribution margins are too low.
Products with healthy contribution margins have more resources to recover advertising costs, whereas products with thin margins may struggle to turn a profit despite strong sales.
To make more informed investment decisions, businesses can combine contribution margin analysis with Digital Marketing Analytics to determine whether advertising campaigns are generating profitable growth rather than just increasing revenue.
Organizations that monitor both contribution margin and advertising performance can better allocate marketing budgets, improve return on investment, and support long-term business growth.
Common Calculation Mistakes
Even though the contribution margin formula is relatively simple, inaccurate calculations can lead to misleading conclusions about business profitability. Below are some of the most common mistakes businesses make when calculating contribution margin.
1. Excluding Variable Costs
One of the most common mistakes is including only the cost of goods sold (COGS) while overlooking other variable expenses such as shipping fees, payment processing charges, packaging costs, discounts, and refunds.
Since contribution margin measures the revenue remaining after all variable costs have been deducted, omitting these expenses may overstate profitability and lead to poor business decisions.
2. Confusing Contribution Margin with Gross Profit
Contribution margin and gross profit are related but are not interchangeable. Gross profit considers only the cost of goods sold, whereas contribution margin includes all variable costs associated with each sale.
Using gross profit as a substitute for contribution margin can result in inaccurate assessments of product profitability.
3. Including Fixed Costs in the Calculation
Another common mistake is subtracting fixed operating expenses—such as rent, salaries, software subscriptions, or advertising—when computing contribution margin.
These expenses are not part of the contribution margin formula and should be considered separately when evaluating overall profitability.
4. Focusing Only on Revenue
High sales do not always indicate high profitability. Products with strong revenue but low contribution margins may contribute less to the business than products with lower sales but healthier margins. Evaluating both revenue and contribution margin provides a more complete picture of financial performance.
Businesses can use operational optimization to identify cost inefficiencies, improve pricing strategies, and strengthen overall profitability.
5. Using Incomplete or Poor-Quality Data
Contribution margin calculations are only as reliable as the underlying data. Missing transactions, duplicate records, or incorrectly categorized expenses can distort profitability analysis and lead to inaccurate business decisions.
Before performing any financial analysis, businesses should validate their data to ensure that revenue and cost records are complete and accurate.
Using Contribution Margin for Better Business Decisions
According to the Corporate Finance Institute (CFI), contribution margin plays an important role in managerial decision-making because it helps businesses assess product profitability, perform break-even analysis, and determine how changes in pricing or costs affect overall financial performance.
Pricing Strategies
Contribution margin helps businesses evaluate whether product prices are sufficient to cover variable costs while generating enough revenue to contribute toward fixed operating expenses and profit.
Products with consistently low contribution margins may require price adjustments, supplier negotiations, or cost reductions to remain financially sustainable.
Product and Sales Channel Evaluation
Not all products or sales channels contribute equally to profitability. Comparing contribution margins across products, marketplaces, or distribution channels allows businesses to identify which offerings generate the greatest financial value.
This enables managers to prioritize high-performing products while reviewing or improving lower-performing ones.
Organizations can strengthen these evaluations through Operational Optimization Solutions, which use data-driven analysis to improve operational efficiency, reduce unnecessary costs, and support more profitable business processes.
Marketing and Budget Allocation
The contribution margin is also useful in evaluating marketing investments. Rather than allocating budgets solely based on revenue, businesses can determine whether advertising campaigns generate a sufficient contribution margin to cover their costs. This approach promotes more efficient budget allocation and increases overall profitability.
Forecasting and Strategic Planning
Contribution margin is commonly used in financial forecasting and break-even analysis to determine how changes in sales volume, pricing, or variable costs affect profitability. Understanding how each sale contributes to covering fixed expenses allows businesses to develop more realistic revenue targets, budgeting plans, and growth strategies. As highlighted by Harvard Business School, combining financial metrics with data-driven analysis enables organizations to make more informed strategic decisions and improve long-term business performance.
Organizations can support these activities by combining contribution margin analysis and business forecasting, which shows how data-driven forecasting can support strategic planning and decision-making.
Key Takeaways
Contribution margin is a practical profitability metric that helps e-commerce businesses make more informed financial and operational decisions. Keep these key points in mind:
- Look beyond revenue. High sales do not always mean high profitability. Contribution margin reveals how much revenue remains after variable costs are deducted.
- Include all relevant variable costs. Ensure that costs such as COGS, shipping, fulfillment, payment processing fees, discounts, and refunds are accurately accounted for to avoid overstating profitability.
- Use contribution margin to guide decisions. Apply it to evaluate pricing strategies, compare product performance, allocate marketing budgets, and improve operational efficiency.
- Maintain high-quality data. Accurate and complete data leads to more reliable profitability analysis and better business decisions.
- Turn insights into action. Combining contribution margin with broader data-driven business solutions enables organizations to make more informed decisions and achieve sustainable growth.