
Sales and Operations Report
Report Overview
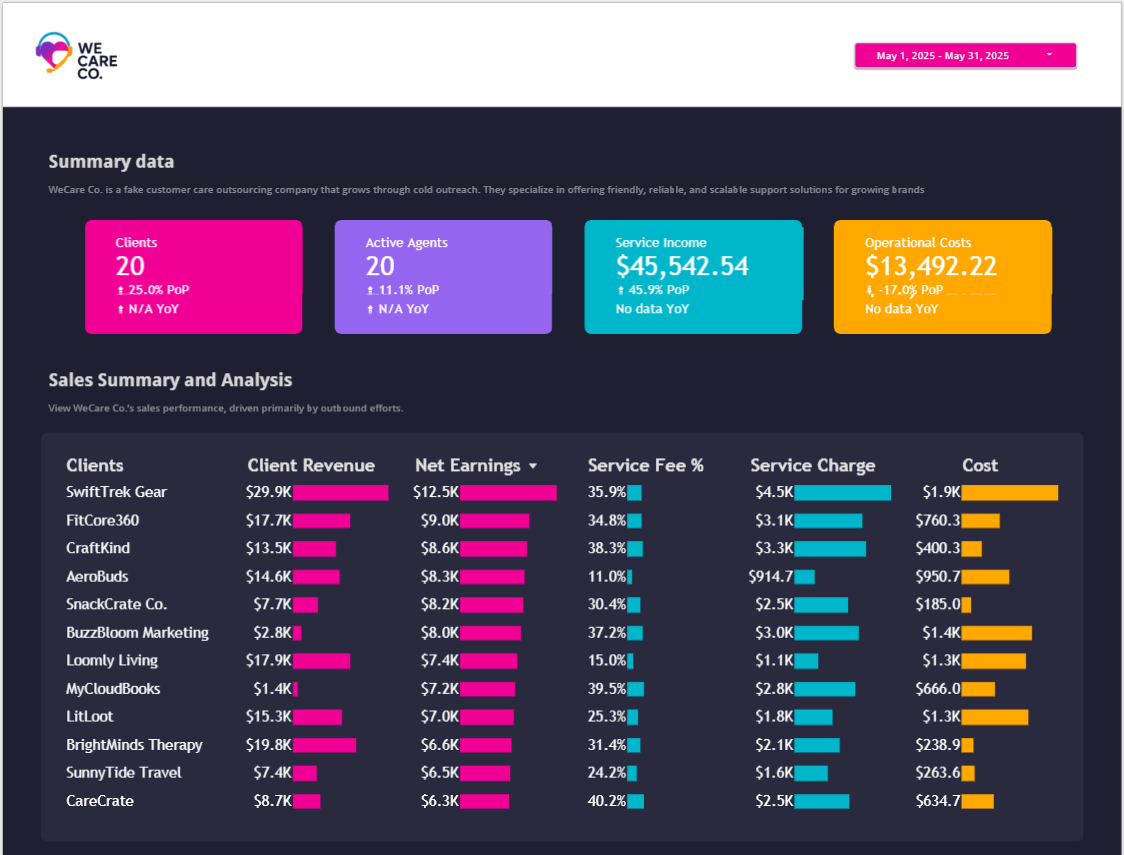
This Sales and Operations Report provides a comprehensive view of client-based sales performance and operational efficiency for a mock cold outreach and support company. It highlights key metrics such as revenue performance, account activity, and cost efficiency to evaluate overall business effectiveness.
The report enables business leaders to identify top-performing accounts, analyze profitability, and optimize service pricing models based on real earnings data. Through an interactive dashboard, it supports clearer decision-making and more efficient sales and operations planning.
Business problem
Sales performance and operational efficiency were hard to evaluate together in one place.
What we built
A combined sales-and-operations dashboard covering revenue, account activity and cost efficiency.
How it works
- SQL and Google Sheets consolidate the sales and operations data.
- Looker Studio (Data Studio) presents revenue, activity and cost efficiency together.
- Overall business effectiveness is readable at a glance.
Business impact
An estimated 5 hours of manual reporting saved each month across sales and operations.
Dashboard Results and Performance
Explore this sales and operations report dashboard below to see revenue performance, account profitability, and cost efficiency in one interactive view. Built in Data Studio (formerly Looker Studio), you can filter by account or time period to identify top performers and spot where pricing or cost decisions need attention.
Our Sales and Operations Report Process
This sales and operations report outlines how client sales and operational data is collected, organized, and analyzed to evaluate performance and business efficiency. It begins with gathering data from sales activities and operational records, followed by cleaning and structuring to ensure accuracy and consistency. The prepared data is then analyzed to assess revenue performance, cost efficiency, and account-level profitability. Insights are presented through an interactive dashboard, enabling stakeholders to identify top-performing clients, optimize pricing strategies, and improve overall sales and operations planning.
Sales and Operational Data Collection
Data Cleaning and Structuring
Revenue and Account Performance Analysis
Pricing and Cost Optimization Review
Dashboard Visualization and Planning Insights
More Dashboards
Smarter Spreadsheet Automation
Automated Access Management
Integrations Report
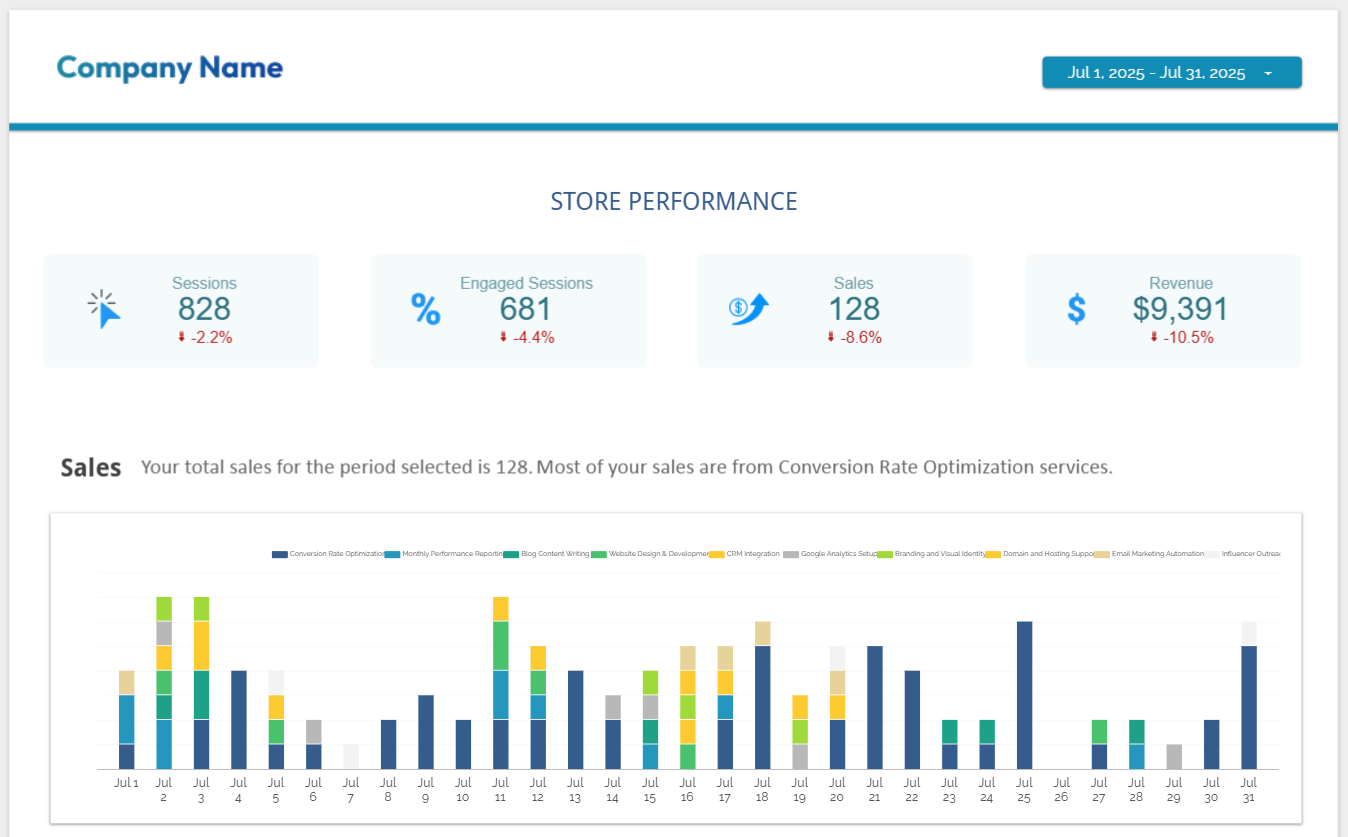
Marketing Analytics Report
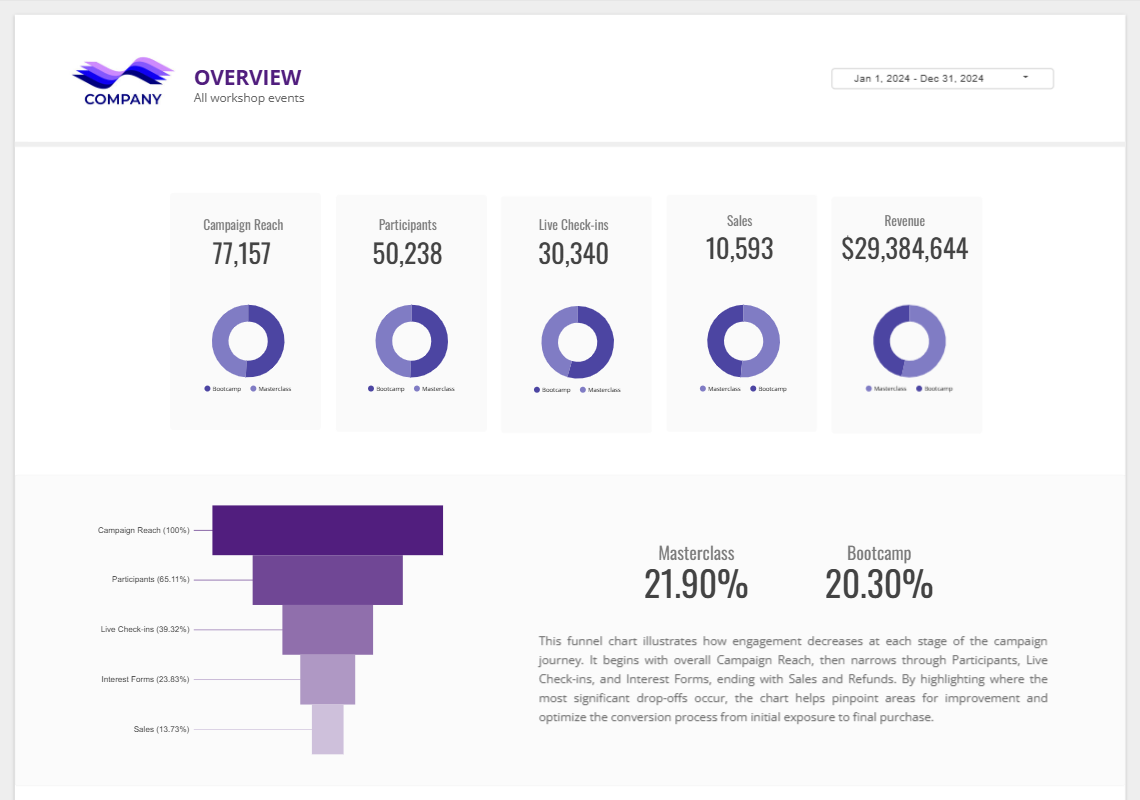
Workshop Report
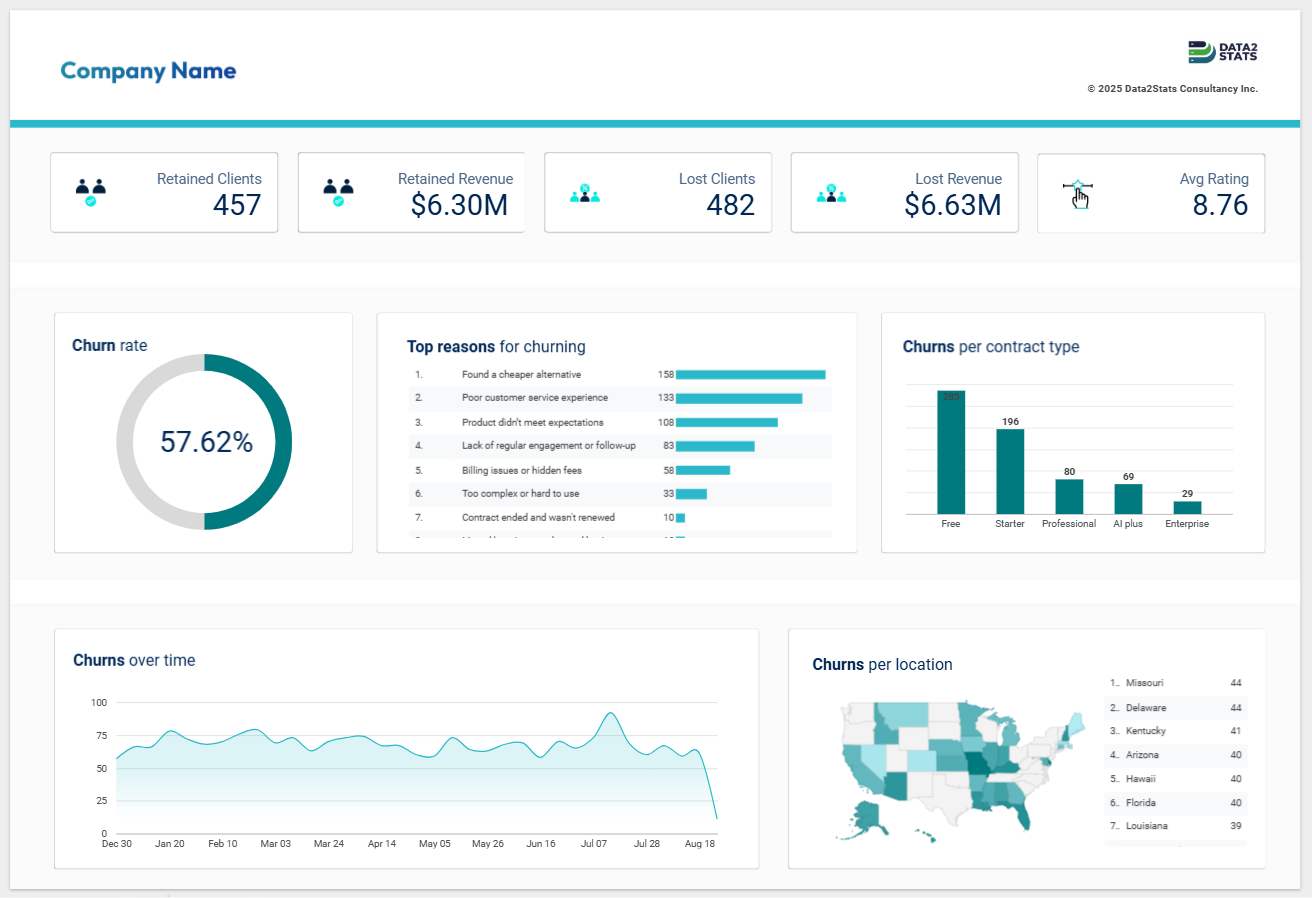
Churn Analysis Report
Sales and Operations Report
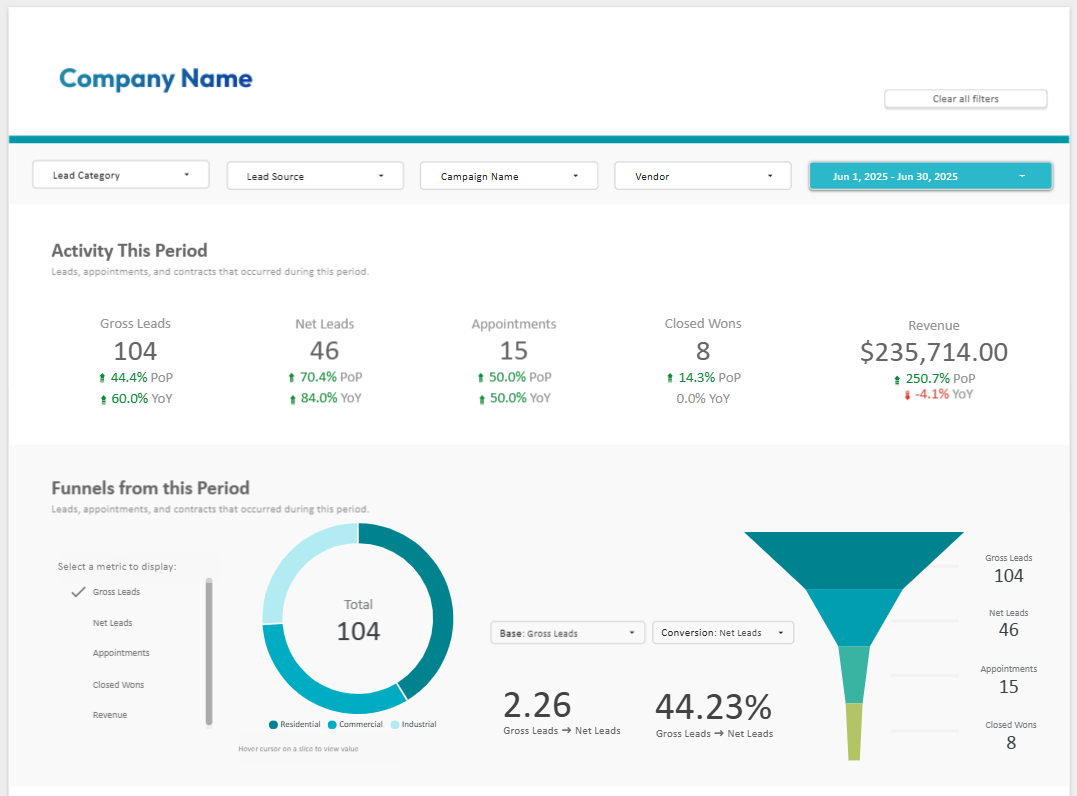
Real Estate Report
Frequently Asked Questions
A sales and operations report combines revenue performance, account activity, and cost efficiency data into one view, answering key questions like which clients are most profitable, where costs are running high, and whether current pricing reflects the value being delivered.
By comparing actual earnings against service costs at the account level, this sales and operations report surfaces whether current pricing models are generating the expected margin; and where adjustments would have the strongest impact on profitability.
Yes, the report ranks accounts by revenue contribution and profitability so sales teams can prioritize high-value relationships and identify which accounts may not be worth the operational cost they require.
Both, while the sales and operations report is built on historical data, the account and cost insights it surfaces directly inform forward-looking decisions around pricing strategy, resource allocation, and which client segments to target next.
The dashboard is built in Data Studio (formerly Looker Studio), with data prepared in Google Sheets and SQL. It brings account-level revenue and cost data into one filterable view without requiring manual exports from multiple sources.
Not Sure Which Clients Are Actually Profitable?
Get a clear account-level view of revenue, costs, and pricing performance.
If your sales data lives in spreadsheets and you can't easily tell which accounts are driving real profit, we'll build you a sales and operations report that breaks it down by account, cost, and margin; so your next pricing or planning decision has a solid foundation.
Let's Talk