 Gezille Gaddi
Customer acquisition is one of the primary goals of marketing. Whether running digital advertisements, email campaigns, or social media promotions, businesses invest marketing budgets to attract new customers and drive revenue. However, attracting more customers is only one part of the equation. The cost of acquiring those customers also plays a significant role in determining whether marketing efforts are sustainable and profitable.
One of the most widely used metrics for this purpose is Customer Acquisition Cost (CAC). By understanding how much it costs to acquire each customer, businesses can assess the efficiency of their marketing efforts, allocate budgets more effectively, and identify opportunities to improve campaign performance. Monitoring acquisition costs over time also allows organizations to recognize when increasing marketing spend no longer produces proportional returns.
In this article, we’ll walk through how Customer Acquisition Cost (CAC) is calculated, why a lower CAC isn’t always the goal, and how visualizing the data can help identify diminishing returns and support smarter marketing decisions.
What is Customer Acquisition Cost?
Customer Acquisition Cost (CAC) measures the average amount a business spends to acquire one new customer during a specific period. It is one of the most commonly used marketing metrics for evaluating how efficiently marketing investments generate customer growth.
CAC is calculated using the following formula:
For example, if a business spends ₱100,000 on marketing and acquires 2,000 new customers, the CAC is ₱50. This means the business spent an average of ₱50 to acquire each new customer.
Tracking CAC over time gives businesses a clearer picture of how efficiently their marketing budget is being used. It also makes it easier to compare campaigns, spot changes in performance, and make better budgeting decisions. However, interpreting CAC requires more than simply aiming for the lowest possible value.
When Lower CAC Isn’t Always Better
A lower Customer Acquisition Cost (CAC) is often viewed as a sign of efficient marketing because it means a business spends less to acquire each new customer. However, focusing only on reducing CAC can sometimes lead to decisions that prioritize cost over customer value.
For example, a campaign may achieve a low CAC by attracting customers who make a single purchase and never return. Another campaign may have a higher CAC but attract customers who make repeat purchases or spend more over time. Although the second campaign costs more per acquisition, it may generate greater long-term value for the business.
This is why CAC should be evaluated alongside Customer Lifetime Value (CLV), which estimates the total revenue a customer is expected to generate throughout their relationship with a business. When customers have a high lifetime value, a higher acquisition cost may still be a worthwhile investment.
Instead of chasing the lowest possible CAC, businesses should focus on acquiring customers who provide long-term value. Sometimes spending a little more upfront leads to stronger customer relationships and better returns over time.
Recognizing Diminishing Returns
Customer acquisition does not increase indefinitely as marketing spend grows. While increasing the marketing budget often leads to more customers, the rate of growth eventually begins to slow. This phenomenon is known as diminishing returns, where each additional investment generates progressively smaller gains.
For example, increasing a marketing budget from ₱50,000 to ₱100,000 may result in a substantial increase in new customers. However, increasing the budget from ₱200,000 to ₱250,000 may only produce a small improvement in customer acquisition despite the additional cost.
As marketing spend continues to increase, Customer Acquisition Cost (CAC) may also begin to rise because each additional customer becomes more expensive to acquire. Recognizing this pattern helps businesses identify when marketing investments are becoming less efficient.
Recognizing diminishing returns helps businesses understand when increasing the marketing budget is no longer producing meaningful results. Instead of continuing to spend more, they can focus on the spending levels that deliver the best balance between cost and customer acquisition.
Visualizing CAC Trends
Visualizing Customer Acquisition Cost (CAC) helps businesses identify patterns that may not be immediately apparent from numerical data alone. Charts can reveal how acquisition costs change as marketing spend increases and make it easier to recognize when additional investment begins to produce diminishing returns.
Rather than looking at the numbers alone, let’s visualize the data. In the next section, we’ll use a dummy dataset and Python to calculate Customer Acquisition Cost (CAC) and create charts that make marketing trends and diminishing returns easier to understand.
Note: The dataset used in this article is a dummy dataset created solely for demonstration purposes. It does not represent actual client or company data.
Step 1. Import Libraries
Before we begin the analysis, we first need to import the Python libraries required for data manipulation and visualization. If you’re using Google Colab, simply run the code below.

Step 2: Import the Dataset
With the required libraries loaded, the next step is to import the dataset. In this example, we’ll use a CSV file containing marketing spend and customer acquisition data.
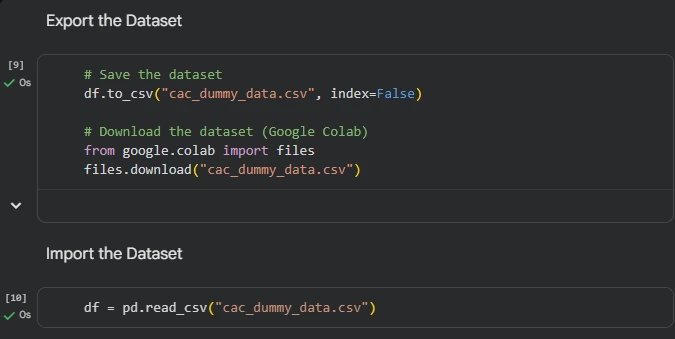
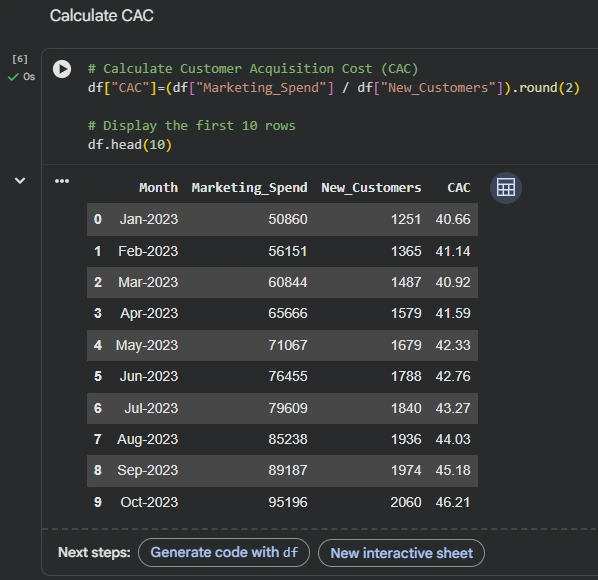
Step 3: Calculate Customer Acquisition Cost (CAC)
Now that the dataset has been imported, we can calculate Customer Acquisition Cost (CAC). This is done by dividing the marketing spend by the number of new customers acquired, creating a new column that we’ll use throughout the rest of the analysis.
Step 4: Visualize the Relationship Between Marketing Spend and Customer Acquisition Cost
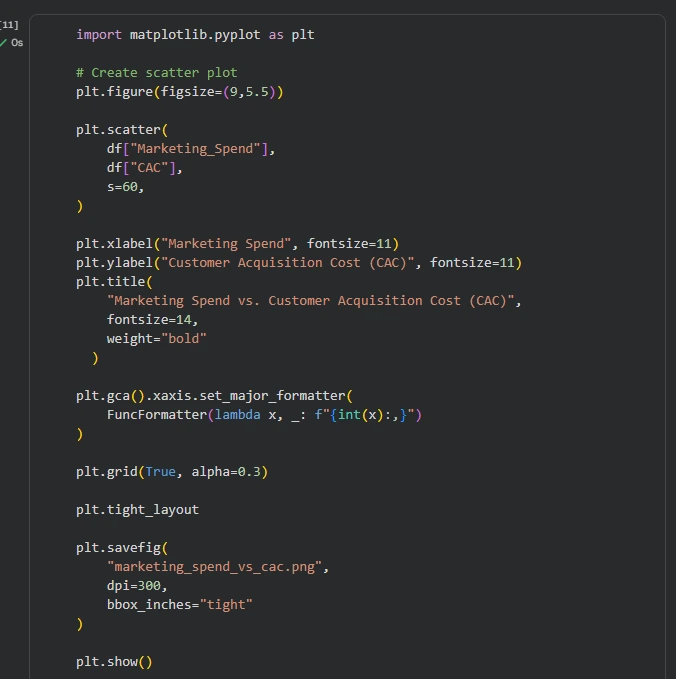
Now that we’ve calculated CAC, let’s see how it changes as marketing spend increases. A scatter plot provides a simple way to visualize this relationship and identify overall trends.
Result
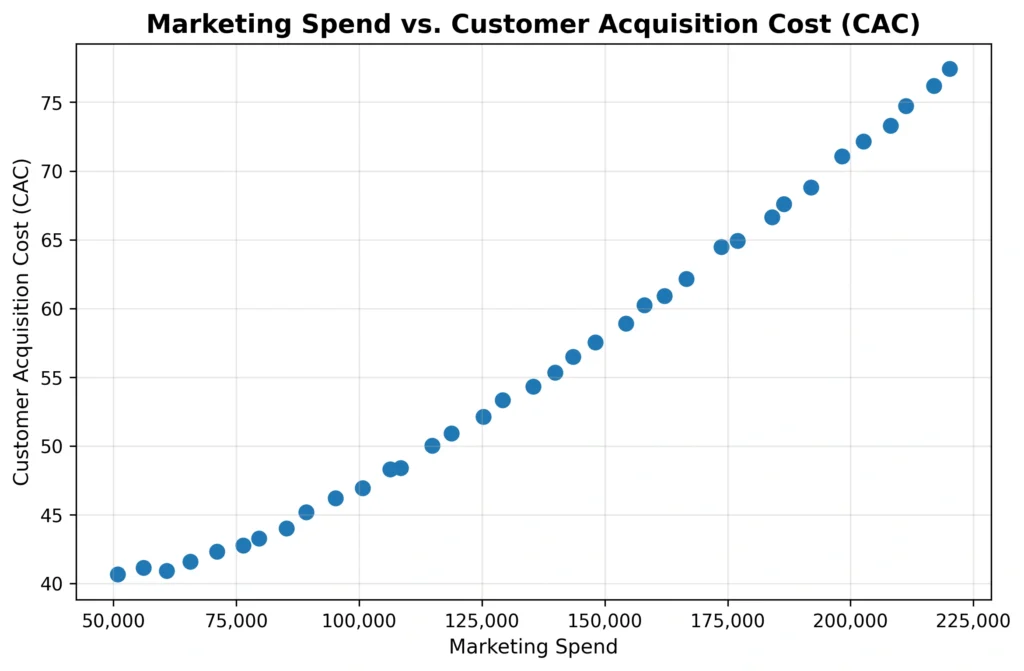
Interpretation: The scatter plot demonstrates a positive relationship between marketing spend and Customer Acquisition Cost (CAC). As marketing spend increases, CAC also tends to rise, suggesting that acquiring additional customers becomes more expensive at higher spending levels. This pattern indicates that simply increasing the marketing budget does not always improve acquisition efficiency.
Step 5: Visualize Customer Acquisition Through a Response Curve
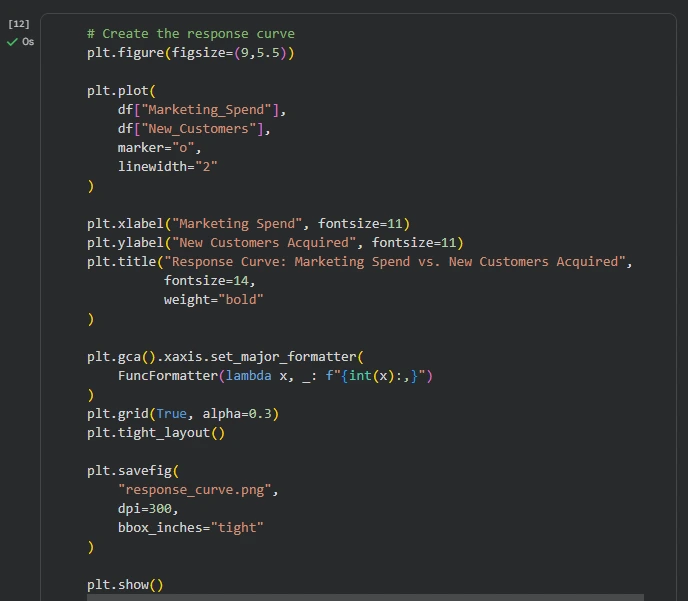
While the scatter plot shows the relationship between marketing spend and CAC, a response curve helps us understand how customer acquisition changes as spending increases. This makes it easier to spot the point where returns begin to level off.
Result
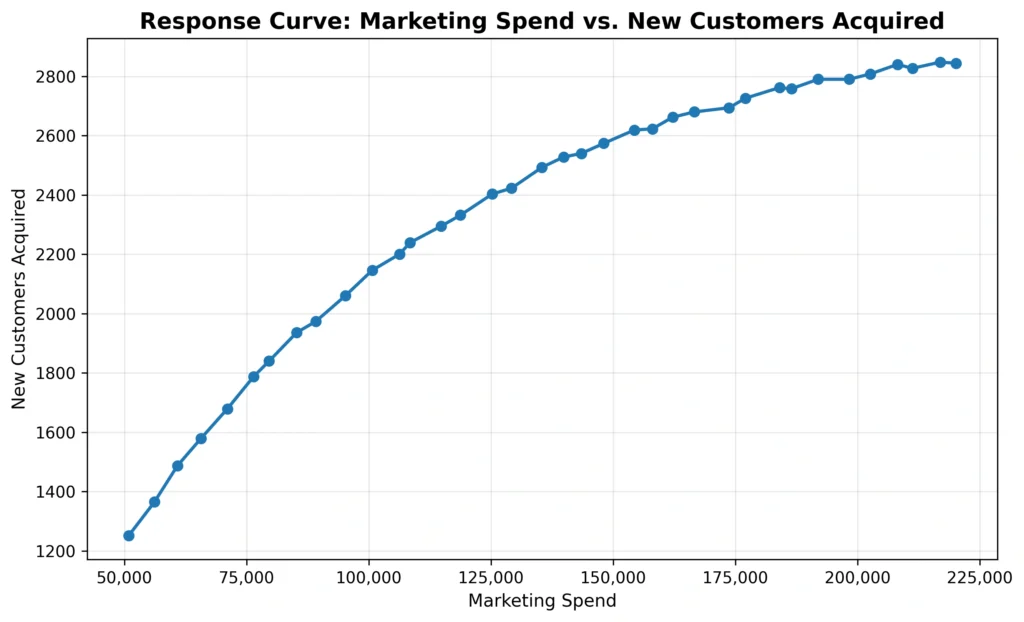
Interpretation: The response curve shows that new customer acquisition increases rapidly at lower marketing spend but gradually begins to level off as spending continues to rise. This flattening of the curve illustrates diminishing returns, where additional marketing investment produces progressively smaller gains in customer acquisition.
Step 6: Analyze Monthly Customer Acquisition Trends
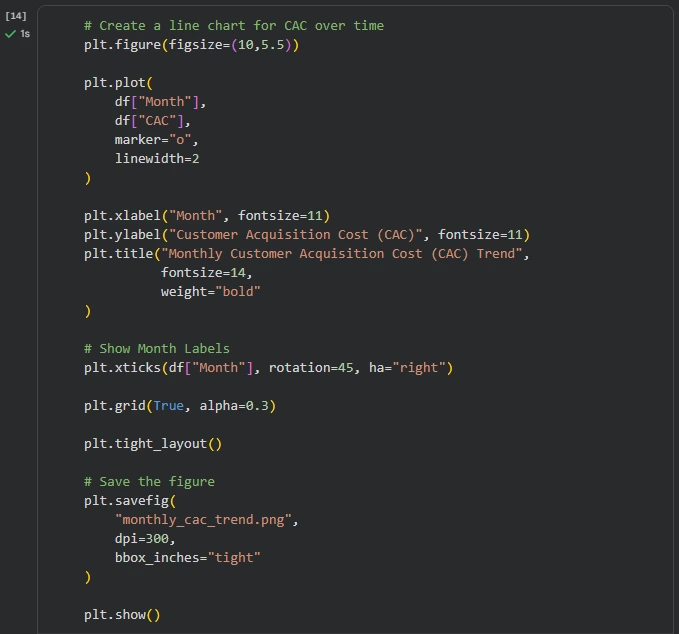
Finally, let’s look at how Customer Acquisition Cost changes over time. A monthly trend chart makes it easier to identify periods where acquisition becomes more expensive and determine whether marketing efficiency is improving or declining.
Result
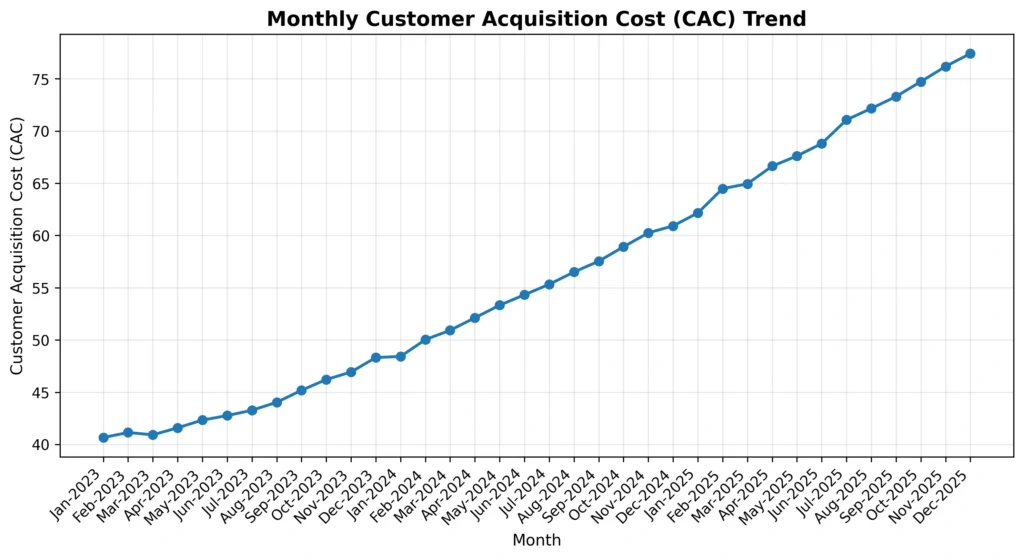
Interpretation: The monthly Customer Acquisition Cost (CAC) trend shows a gradual increase throughout the observed period. This indicates that acquiring new customers becomes more expensive over time, highlighting the importance of regularly monitoring marketing performance and adjusting budget allocations to maintain acquisition efficiency.
How Businesses Can Optimize Spend
The insights from the previous visualizations can now be used to support better marketing decisions. Rather than simply increasing the advertising budget, businesses can use CAC and response curves to decide where, when, and how much to invest.
Allocate Budgets Based on Performance
Marketing budgets should be directed toward campaigns and channels that consistently acquire customers at a sustainable cost. Regularly reviewing CAC across different campaigns helps identify which strategies are delivering the best results.
Test Different Spending Levels
Instead of making large budget increases, businesses can gradually adjust marketing spend and monitor how customer acquisition responds. This approach makes it easier to identify the point where additional spending begins to produce diminishing returns.
Continuously Monitor CAC
Customer behavior and market conditions change over time, making it important to monitor CAC regularly. Tracking acquisition costs alongside other performance metrics enables businesses to identify trends early and adjust their marketing strategies before efficiency declines.
Ultimately, optimizing marketing spend is an ongoing process rather than a one-time task. By continuously monitoring CAC and using data to guide decisions, businesses can allocate their budgets more effectively, improve marketing performance, and support sustainable customer growth.
Conclusion
Customer Acquisition Cost (CAC) is a valuable metric, but it becomes even more useful when it’s analyzed alongside marketing trends and customer response. By visualizing the data, businesses can better understand where their marketing budget is creating the most value and where additional spending begins to deliver diminishing returns.
This is exactly why data-driven decision-making matters. At Data2Stats, turning data into meaningful insights helps businesses move beyond assumptions and make more confident marketing decisions. With the right analysis, organizations can optimize their budgets, improve campaign performance, and achieve more sustainable growth.