 Straña Abigail A. Villacis
MER decline is something every marketing team eventually runs into: the ad budget goes up, but revenue does not follow at the same pace. The Marketing Efficiency Ratio (MER)—total revenue divided by total marketing spend—starts to slide, even though nothing about the campaigns themselves has obviously gotten worse. This isn’t a sign that marketing has stopped working. It’s a predictable, well-documented pattern called diminishing returns, and understanding it is one of the most useful things a business can do before committing to a bigger ad budget.
This article walks through why MER decline happens, what drives it, and how statistical modeling can help teams anticipate it instead of being surprised by it.
Why Scaling Isn’t Always Efficient
It’s tempting to assume that if $10,000 in ad spend produced $50,000 in revenue, then $20,000 should produce $100,000. In practice, this kind of linear thinking rarely holds up once a channel matures. Scaling ad spend means reaching further into an audience—past the people who were easiest and cheapest to convert—and paying more to compete for the attention that remains.
Efficiency and scale are often in tension: a business can usually grow revenue by spending more, but the rate of return on each additional dollar contributes progressively less incremental revenue, illustrating the principle of diminishing returns. Recognizing this tension early helps teams set realistic expectations for what a bigger budget can actually deliver.
Understanding Diminishing Returns
Diminishing returns describe a situation in which each additional unit of input produces a smaller additional unit of output than the previous one. In advertising terms, this means each additional amount spent generates less incremental revenue than the previous increment.
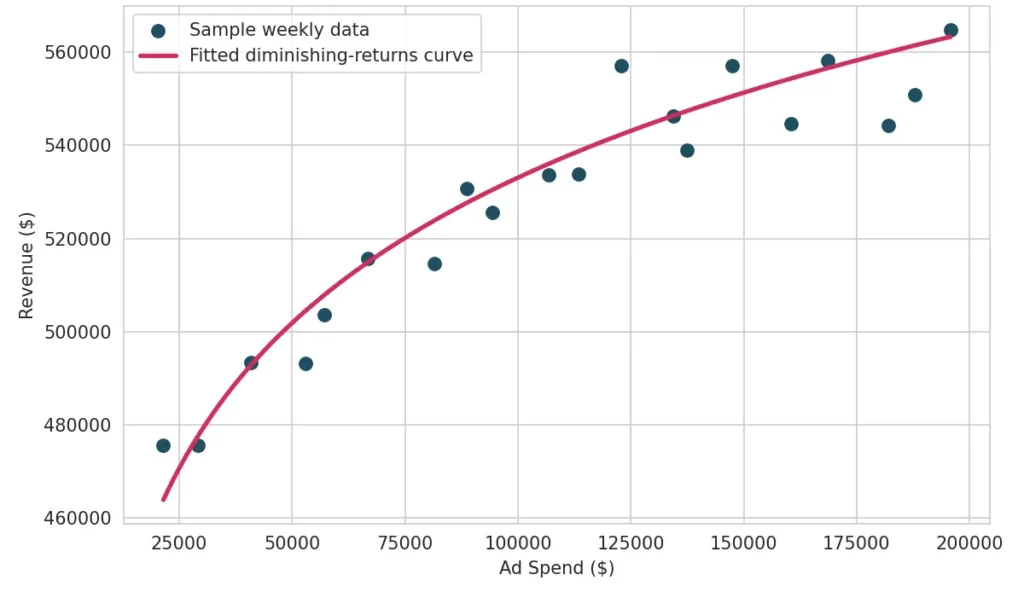
The relationship is not linear but curved: revenue still climbs as spend increases, but at a progressively flatter rate. This is typically modeled using a log-spend relationship, where revenue is expressed as a function of the logarithm of ad spend rather than spend itself, since a log curve naturally captures fast early growth followed by a slower, gradually decelerating rate of increase.
Understanding MER Decline as Spend Grows
MER declines as spend grows because the denominator of the ratio (ad spend) increases faster than the numerator (revenue) does, once a channel moves past its most efficient range. Early ad dollars tend to reach a business’s warmest, most responsive audience—people already close to a purchase decision—so those dollars convert efficiently and MER stays high.
As spend increases further, campaigns are forced to reach colder or less relevant audiences, and cost-per-result rises. The result is a mathematically predictable decline in MER, even when campaign execution, creative quality, and targeting remain unchanged. What’s changed is the audience: the easiest, most responsive buyers have already been reached.
Audience Saturation Explained
Audience saturation happens when a brand has already reached most of the people within a target segment who are realistically likely to buy. Beyond that point, additional impressions mostly land on people who have already seen the ad multiple times or who were never a strong match for the offer in the first place.
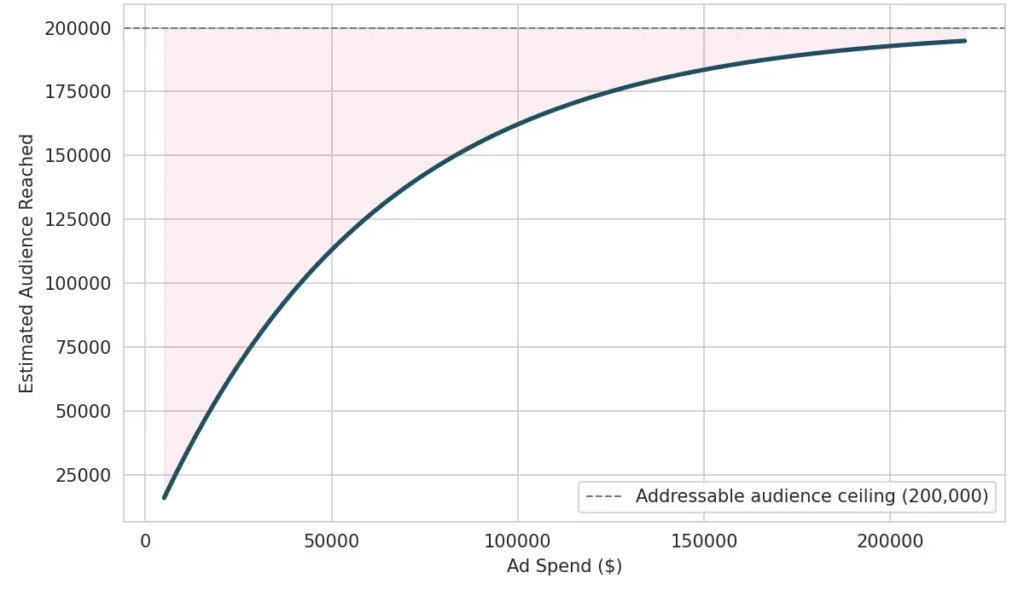
As an illustrative example: if a campaign’s addressable audience is roughly 200,000 people and a brand has already reached 180,000 of them, the next batch of ad spend is largely paying to re-show the same ads rather than to find new buyers—which shows up directly as a lower MER, even before accounting for what it now costs to win each of those impressions.
Increased Auction Competition
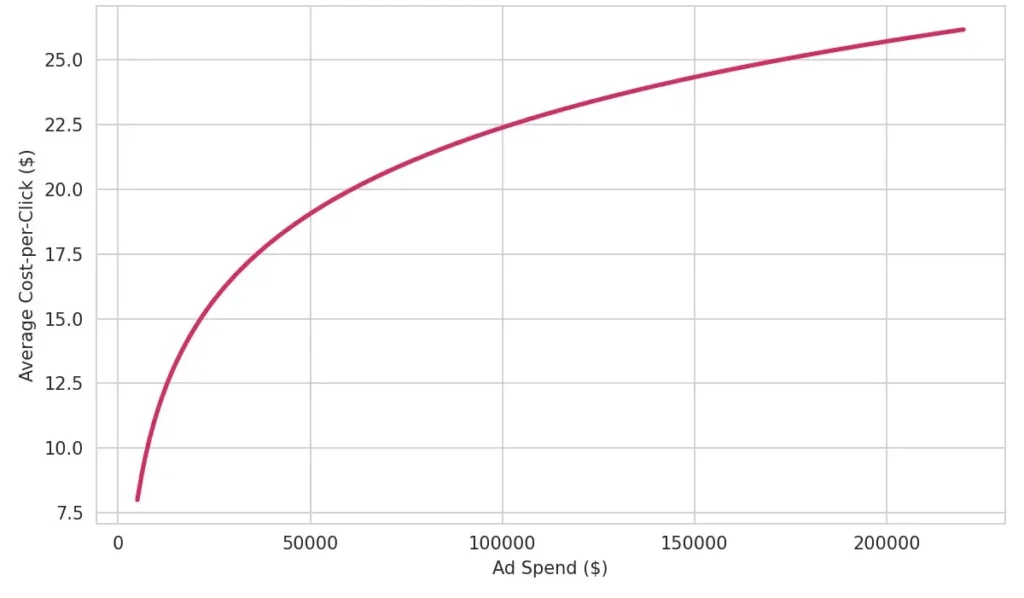
Most digital ad placements are sold through real-time auctions, where advertisers bid against each other for the same impressions. As a business increases its own spend, it is often also bidding more aggressively and more frequently, which pushes up its own cost-per-impression and cost-per-click—separate from anything competitors are doing. On top of that, spending more usually means expanding into broader or less-targeted audience segments, which are already more contested by other advertisers. Both effects raise acquisition costs and compress MER as budgets climb.
Customer Acquisition Costs
Customer Acquisition Cost (CAC) and MER are two sides of the same coin: as CAC rises, MER falls, because more spend is required to generate the same unit of revenue.
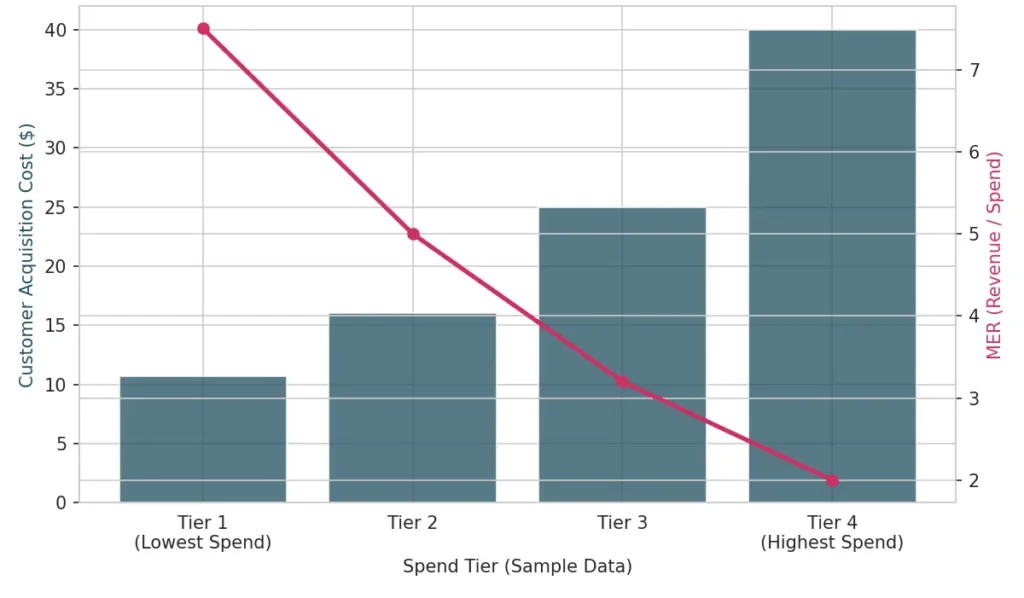
As an illustrative example, suppose a business acquires its first 100 customers at an average CAC of $11, while ad spend is still low but as it scales past that point, the CAC rises roughly to $40 because those customers are harder to reach and slower to convert. Even if average order value stays constant, this shift alone is enough to noticeably lower MER, which is why tracking CAC trends alongside MER gives a fuller picture of where diminishing returns are starting to bite.
How Businesses Can Detect Their MER Inflection Point
The MER inflection point is the spend level beyond which additional budget starts producing meaningfully smaller returns. Businesses can detect it by plotting historical spending against MER at consistent intervals—weekly or monthly—and watching for the point where the curve visibly flattens.
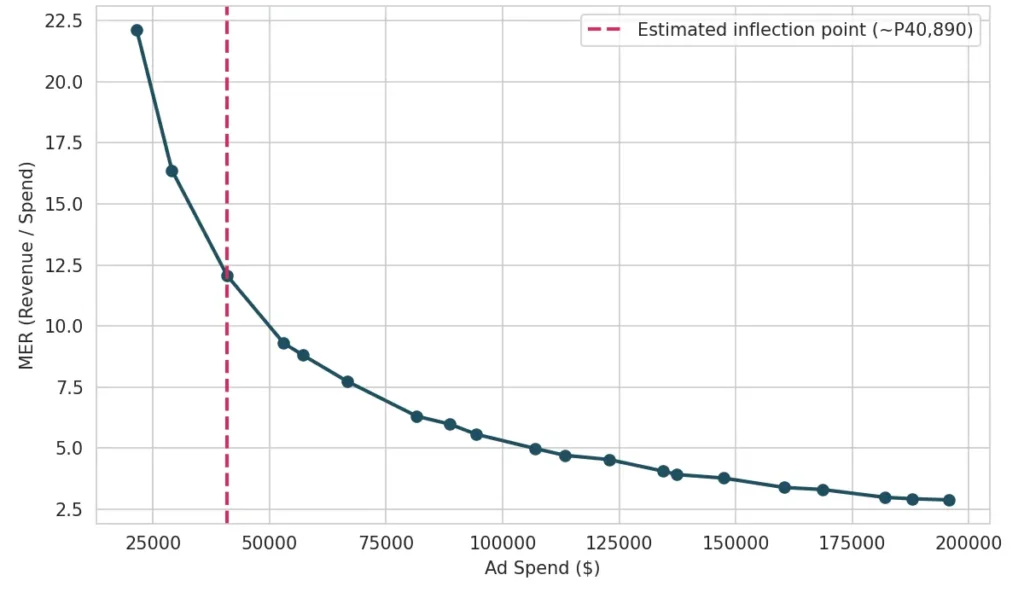
Structured incrementality tests, such as geo-holdouts or spend-lift experiments, provide a cleaner read by comparing outcomes between regions or periods with different spend levels. Tracking MER alongside secondary signals like CAC, frequency, and audience reach also helps confirm whether a flattening trend is a genuine saturation effect or a temporary dip caused by seasonality or a short-term campaign issue.
Statistical Models That Help Predict MER
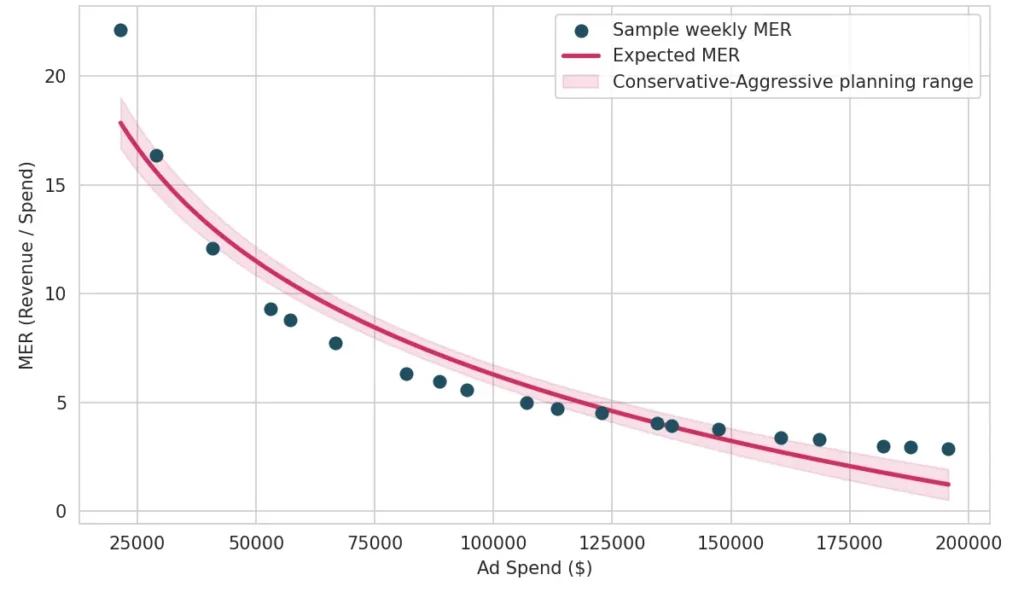
Regression modeling offers a more rigorous way to quantify the diminishing returns relationship than eyeballing a chart. A common approach is a log-spend regression, where MER is modeled as a function of the natural log of ad spend: MER = β₀ + β₁ × ln(Spend).
As a purely illustrative example using sample data, a fitted model might return an intercept of 92.84 and β₁ = −7.52 (R² = 0.911), meaning that each doubling of ad spend is associated with roughly a 5.2-unit drop in MER. Around this fitted line, residual-based planning ranges (for example, a Conservative, Expected, and Aggressive scenario band) can be built to show decision-makers not just the expected MER at a given spend level, but the realistic range it could fall within. This turns diminishing returns from an abstract concept into a concrete planning tool for budget-setting conversations.
Beyond a single-variable log-spend regression, more advanced approaches are often layered on once a business wants finer-grained answers:
- Marketing Mix Modeling (MMM) — extends the same idea across multiple channels at once, applying saturation curves (such as Hill or S-curve functions) and adstock effects so each channel’s own diminishing-returns shape and carryover impact are modeled individually rather than assumed to be uniform.
- Time series models (ARIMA, Prophet) — take a different angle, focusing less on why MER declines and more on where it’s headed next, since they capture trend and seasonality in weekly or monthly MER data that a static regression can’t.
- Tree-based machine learning models (Random Forest, Gradient Boosting) — flexibly pick up nonlinear patterns and interactions between spend, seasonality, and other drivers when the relationship doesn’t follow a clean log curve, trading some interpretability for flexibility.
In practice, most teams start with the simpler log-spend regression and only reach for these heavier models once they need multi-channel breakdowns, forward-looking forecasts, or better fit on messier data.
Key Takeaways
MER decline as spend increases is not a red flag on its own—it is the expected, mathematically consistent result of audience saturation, rising auction competition, and increasing customer acquisition costs. What matters is knowing where a business’s own inflection point sits, so that budget decisions are made with clear eyes about the trade-off between scale and efficiency. Simple statistical tools, like log-spend regression models and scenario-based planning ranges, give businesses a repeatable way to estimate that inflection point and plan ad spend with confidence rather than guesswork.
Note: All figures and datasets referenced above are illustrative sample data used for explanatory purposes only and do not represent actual client or company figures.