Introduction to Daily Pulse
A daily pulse report offers a quick yet meaningful snapshot of a team, business operation, product, or process. Designed to provide an at-a-glance view of the current performance and overall health, it helps teams stay informed on what’s happening in real time without the need for lengthy or overly formal reporting.
Numbers alone rarely tell the full story, which is why daily pulse reports go beyond simply presenting data. They transform raw figures into meaningful insights by analyzing how performance is trending over time — whether through month-on-month, year-on-year, quarter-on-quarter, or week-on-week comparisons, depending on the seasonality and business context.
From these insights, actionable recommendations can then be developed to help guide decision-making. Instead of leaving teams to interpret the numbers on their own, daily pulse reports provide a clearer understanding of what is happening and outline the next best actions to take based on current performance trends.
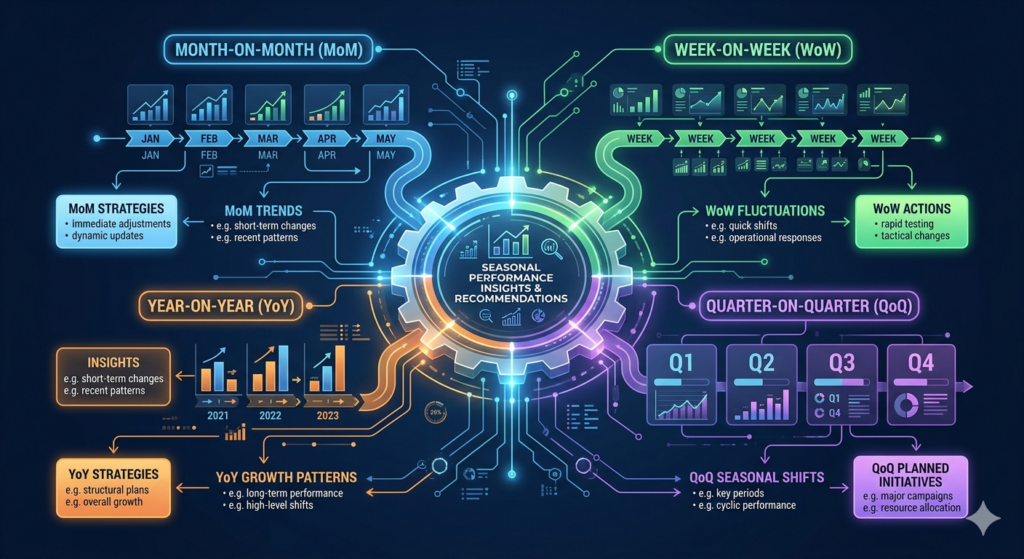
Different seasonalities which can be used for creating daily pulse reports.
What is Ecommerce?
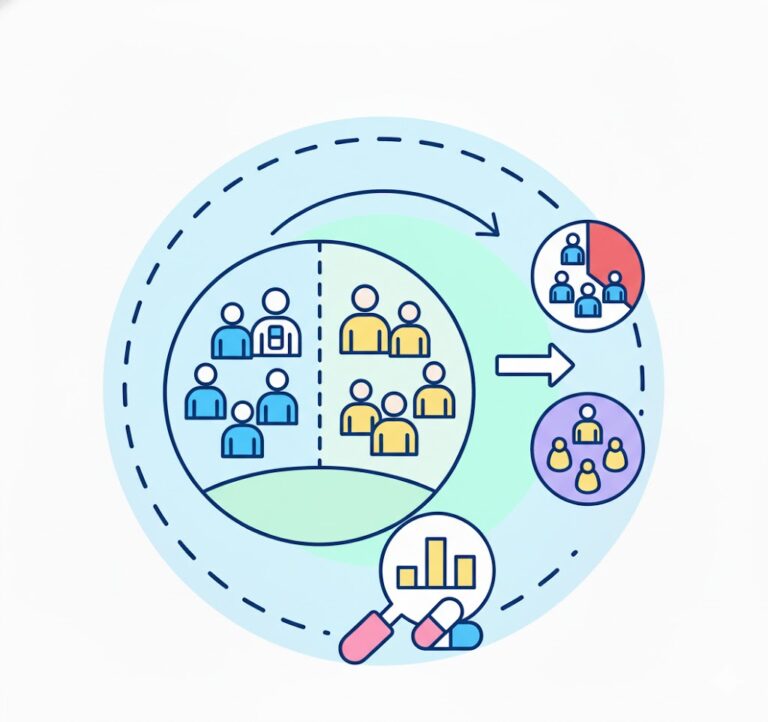
E-commerce refers to the buying and selling of goods over the internet, where money and data are exchanged to complete transactions. Any business that sells products or services online falls under this category. This ranges from large online marketplaces like Amazon and Etsy to food delivery platforms and even B2B service providers, all operating within the digital commerce ecosystem.
Generally divided into four main types based on who is buying and selling. Business to Consumer (B2C) involves companies selling directly to customers, while Business to Business (B2B) is when businesses sell to other businesses. Consumer to Business (C2B) happens when individuals sell to companies, and Consumer to Consumer (C2C) involves people selling directly to each other through online marketplaces.
Metrics and KPIs Usually Used in Ecommerce Daily Pulse
Choosing which metrics and KPIs to use in generating your own daily pulse may depend on the type of your business. In ecommerce businesses, the usually used metrics and KPIs are the following but not limited to:
- Traffic – Website traffic is a key metric for any e-commerce business because it directly affects sales potential. However, high traffic alone is not enough if visitors are not converting into customers. A low conversion rate may indicate that the wrong audience is being targeted, making it important to review customer acquisition strategies. Since traffic can be directly influenced through marketing and advertising efforts, attracting the right audience is essential for improving overall performance and conversions.
- Conversion Rate (CVR) – Conversion rate measures the percentage of visitors who make a purchase and is influenced by factors such as website experience, products, and marketing efforts. It is calculated by dividing total purchases by total visitors and multiplying by 100. To improve conversion rates, businesses can analyze the conversion funnel to identify where customers drop off — from visiting the site and viewing products to adding items to cart, reaching checkout, and completing a purchase.
- Orders – Orders are driven by both website traffic and conversion rate, as traffic multiplied by conversions equals total orders. To increase orders, businesses need to improve traffic, conversion rate, or both. A common mistake is treating orders as the main metric to directly influence, when in reality, the focus should be on the factors that drive them — attracting more visitors and converting more of those visitors into customers.
- Sales – Gross sales is a straightforward metric that can be tracked daily through Shopify. Monitoring daily, weekly, and monthly sales helps ensure performance stays aligned with business goals. If sales suddenly decline on a typically strong-performing day, it may signal an issue that requires immediate attention, such as inventory shortages on top-selling products. Tracking sales regularly helps businesses quickly identify and resolve problems before they impact performance for an extended period.
- Average Order Value (AOV) – Average order value measures the average amount customers spend per order and is calculated by dividing total revenue by total orders. AOV is influenced by the products offered on the website and can be increased through strategies such as product bundles, upselling higher-quantity options, or encouraging customers to add more items to qualify for free shipping or special offers.
- Return on Ad Spend (ROAS) – Return on ad spend (ROAS) measures how much revenue is generated for every dollar spent on marketing and is calculated by dividing sales from marketing campaigns by the marketing budget. It serves as a strong indicator of marketing effectiveness and expected return on investment. Since factors such as ad performance and website experience can affect ROAS, monitoring this metric helps businesses quickly identify potential issues and opportunities in their campaigns.
- Customer Acquisition Cost (CAC/CPA) – This is a metric that often needs to be calculated manually, since many analytics tools only provide CAC for customers acquired through paid channels like PPC campaigns. For other traffic sources, businesses typically compute it themselves, which makes the insight even more valuable for understanding overall performance. The basic formula for CAC is total marketing spend divided by the number of customers acquired.
- Customer lifetime value – Customer lifetime value (CLV) goes beyond average order value by factoring in repeat purchases over time. While AOV focuses on a single transaction, CLV estimates the total revenue a customer generates throughout their relationship with your business. This gives a more accurate view of long-term value and helps evaluate whether customer acquisition is truly profitable when compared against customer acquisition cost (CAC).
- Gross Margin – Gross margin is the profit a business earns after subtracting the cost of goods sold (COGS) from revenue. It shows how much money is left from sales after covering the direct costs of producing or sourcing the product. The formula is: Gross margin = revenue − COGS.
- Net Profit – Net profit is the amount a business earns after all expenses have been deducted from revenue. It reflects the actual profit left once costs such as operations, marketing, and overhead are accounted for. The formula is: Net profit = revenue − expenses.
Advantages and Disadvantages of Daily Pulse
Advantages
- Real-time visibility – Daily pulse reports provide up-to-date insight into performance, helping teams quickly understand what’s working and what isn’t without waiting for weekly or monthly reports.
- Faster decision-making – With fresh, frequent data, managers can quickly adjust campaigns, budgets, or operations before small issues escalate.
- Early problem detection – Sudden drops in revenue, rising costs, or operational delays can be identified early, reducing risk and preventing ongoing inefficiencies.
- Better accountability – Regular reporting keeps teams aligned with targets and encourages consistent performance, as results are monitored daily.
- Improved operational rhythm – Daily tracking builds a steady feedback loop, helping teams develop habits around monitoring KPIs and acting on insights consistently.
Disadvantages
- Reporting fatigue – Daily reports can become repetitive and overwhelming, especially when there are no major changes in performance.
- Noise over signal – Short-term fluctuations may distract teams from real trends, leading to overreactions to normal daily variation.
- Time and resource cost – Even when automated, daily reporting still requires time to set up, monitor, and review, which can take focus away from execution.
- Risk of reactive decisions – Teams may respond to minor daily spikes or dips instead of waiting for more stable trends to emerge.
- Reduced strategic focus – Constant attention on daily metrics can shift focus away from long-term planning and overall business strategy.
Things to Keep in Mind When Generating Insights
- Focus on “why,” not just “what”
Don’t just report changes in numbers, such as a 10% drop in revenue. Strong insights go a step further by explaining the reason behind the change—for example, “Revenue dropped due to a lower conversion rate from paid social traffic.”
- Compare against a meaningful baseline
Insights only become valuable in context, so always compare performance against relevant benchmarks such as the previous day, week, month, or year, as well as targets or seasonal and campaign cycles. Without this context, raw numbers can be misleading and difficult to interpret accurately.
- Separate signal from noise
Not every fluctuation is meaningful. Focus on sustained trends, significant deviations, and repeated patterns rather than reacting to normal day-to-day variation. This helps prevent unnecessary responses to random spikes or dips in performance.
- Tie insights to business impact
A strong insight should explain why the change matters. Consider whether it affects revenue, efficiency, or growth, whether it requires immediate action or is simply informational, and who should respond to it. If the insight does not influence decision-making, it is likely not meaningful enough.
- Always end with an action or recommendation
Strong insights should not only explain what is happening but also guide the next step. Recommendations such as increasing budget on high-ROAS campaigns, pausing underperforming ads, or investigating checkout drop-offs help turn analysis into actionable decision-making.
Things to Keep in Mind When Generating Recommendations
- Base recommendations on evidence
Recommendations should be grounded in clear data, trends, or observed patterns rather than assumptions. Each recommendation must directly address a measurable issue or opportunity identified in the analysis.
- Make recommendations actionable
Recommendations should be specific and practical rather than vague. Instead of saying “improve marketing performance,” suggest clear actions such as increasing budget on high-performing campaigns, pausing ads with low ROAS for consecutive days, or retargeting abandoned cart users. Specific actions are easier to implement and measure.
- Consider business goals and priorities
Recommendations should align with the company’s overall objectives, whether the focus is profitability, revenue growth, customer acquisition, efficiency, or retention. Since improving one metric may negatively affect another, recommendations should always be evaluated within the broader business context.
- Prioritize based on impact and urgency
Not all recommendations require immediate action. Focus first on high-impact opportunities, critical risks, quick wins, and long-term optimizations to help teams prioritize what matters most and allocate resources effectively.
- Keep recommendations realistic and achievable
Recommendations should align with available resources, budget, timelines, and operational capacity. Effective recommendations are practical, actionable, and realistic to implement. Strong recommendations are data-driven, specific, relevant, prioritized, and action-oriented, making them more useful for both decision-making and execution.
Conclusion
Daily pulse reports serve as a vital tool for maintaining real-time awareness of business performance. By delivering frequent and focused updates, they enable faster decision-making, early issue detection, and stronger alignment across teams. While they require careful balance to avoid overreaction to short-term fluctuations, their value lies in keeping organizations agile, informed, and responsive. Ultimately, when used effectively alongside longer-term reporting, daily pulse reports help build a more proactive and data-driven approach to managing performance and achieving business goals.
At Data2Stats Consultancy Inc., we are committed to delivering fast, reliable, and high-quality services that ensure accurate and comprehensive reporting. We transform your data into clear insights, turning questions into answers supported by actionable recommendations.