Introduction
Dynamic metric selection is a powerful technique for making dashboards more interactive and user-friendly. Instead of creating multiple charts for different KPIs, you can allow users to switch metrics dynamically using parameters and calculated fields. This approach not only simplifies your reports but also improves the dashboard experience for stakeholders.
What Is Dynamic Metric Selection?
Dynamic metric selection allows users to toggle between different metrics (e.g., revenue, orders, conversion rate) within a single chart or visualization. This is commonly done using parameters in tools like Looker Studio.
Why Use Dynamic Metric Selection in Dashboards?
Using dynamic metric selection provides several advantages:
- Reduces dashboard clutter
- Improves user experience
- Makes reports more scalable
- Allows stakeholders to explore data independently
If you’re building advanced dashboards, you may also benefit from our dashboarding and data visualization services
How Dynamic Metric Selection Works
Dynamic metric selection typically involves two key components:
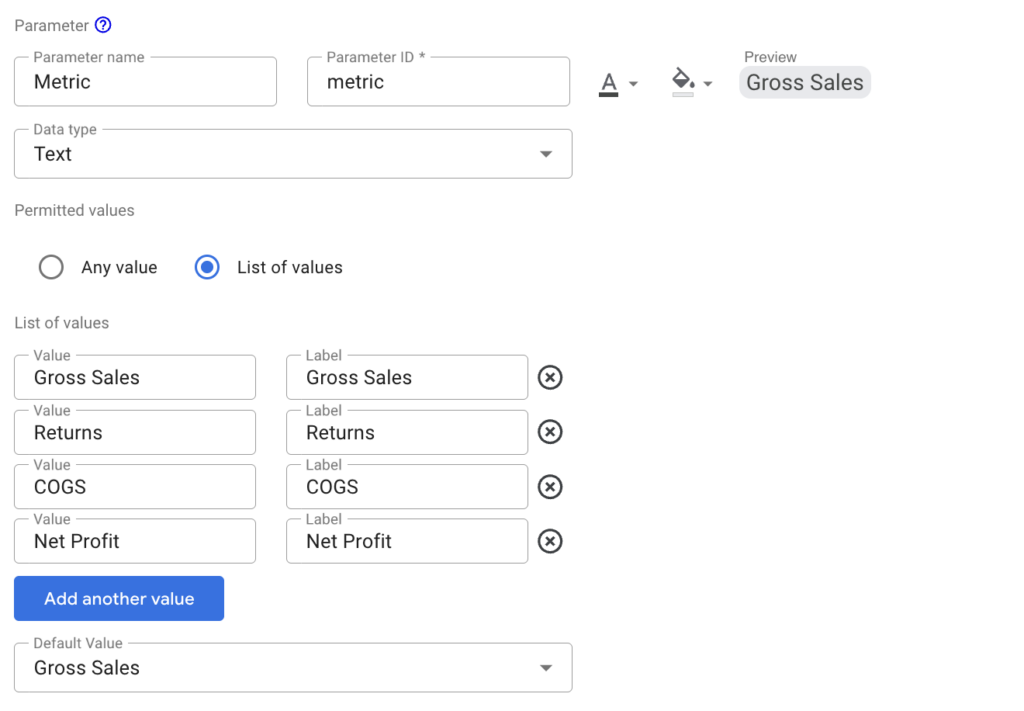
1. Parameter Creation for Dynamic Metric Selection
Create a parameter that lists all available metrics (e.g., Revenue, Net Profit, COGS). This acts as a dropdown control for users. Remember to set the default metric that you want displayed.
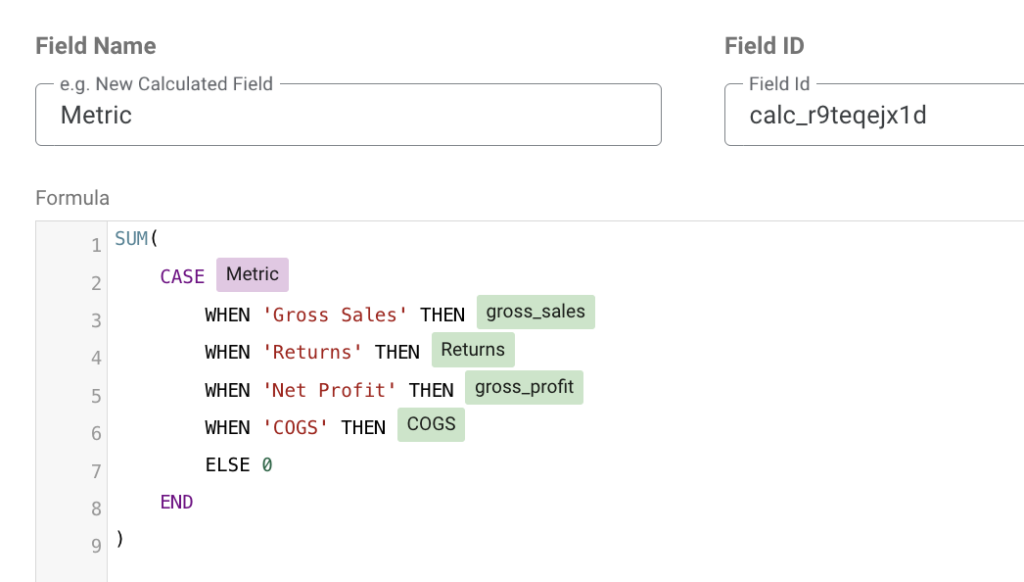
2. Calculated Fields for Dynamic Metric Selection
Use a CASE statement to map the selected parameter value to the corresponding metric.
Use this template for building your calculated field:
SUM(
    CASE {parameter}
        WHEN {value1} THEN {metric1}
        WHEN {value2} THEN {metric2}
        ...
        WHEN {valuek} THEN {metrick}
        ELSE 0
    END
)
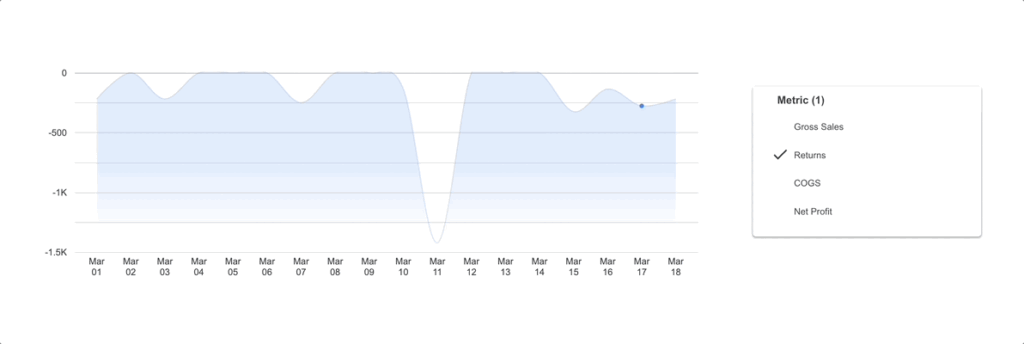
Here’s an example of how you would build this inside Looker Studio:
This method is widely used in BI tools. To learn more about how to use calculated fields, this is explained in Looker Studio’s documentation.
Best Practices for Dynamic Metric Selection
To ensure your implementation is effective:
- Keep metric names user-friendly
- Avoid overly complex CASE logic
- Ensure consistent data formatting
- Test all parameter combinations
For businesses handling large datasets, our big data solutions and services can help optimize performance and data pipelines.
Common Use Cases of Dynamic Metric Selection
Dynamic metric selection is useful in various scenarios:
- Marketing dashboards: Switch between impressions, clicks, and conversions.
- Ecommerce reports: Toggle between revenue, units sold, and average order value.
- Executive dashboards: Allow leadership to view different KPIs without switching pages.
To learn more about building scalable analytics systems, visit our website.
Tools That Support Dynamic Metric Selection
Several tools support this functionality:
- Looker Studio
- Tableau
- Power BI
Conclusion
Dynamic metric selection is an essential technique for creating flexible and user-friendly dashboards. By leveraging parameters and calculated fields, you can reduce complexity while enhancing interactivity. Whether you’re building marketing reports or executive dashboards, this approach helps users focus on what matters most.
If you’re looking to implement advanced dashboard solutions, Data2Stats Consultancy Inc. can help you design scalable and efficient analytics systems tailored to your needs.