Workshop Report
Report Overview
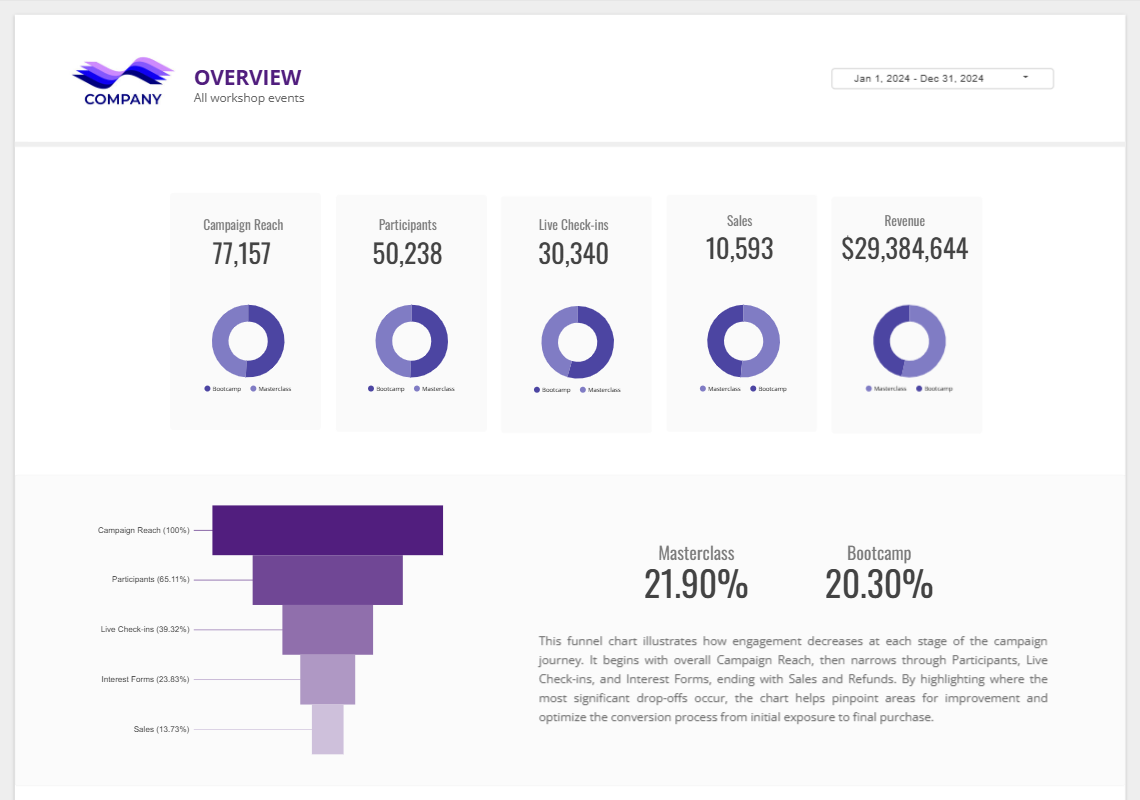
This Workshop Report provides a comprehensive overview of event performance by tracking engagement and conversions across multiple stages of the participant journey. It highlights key metrics from initial campaign reach to final revenue, offering clear visibility into how users interact with each stage of the funnel.
The report enables stakeholders to evaluate overall effectiveness, identify drop-off points, and uncover opportunities to improve engagement and conversion rates. By presenting insights through an interactive dashboard, it supports more informed decision-making and continuous optimization of workshop strategies.
Business problem
Event organizers could not easily see how participants moved from campaign reach through to revenue.
What we built
A workshop performance dashboard that tracks engagement and conversions across every stage of the participant journey.
How it works
- Registration-platform data and Google Sheets feed the pipeline.
- Looker Studio (Data Studio) tracks each stage from reach to revenue.
- Key metrics are visible in one event view.
Business impact
Event performance reporting assembled in minutes instead of roughly half a day.
Dashboard Results and Performance
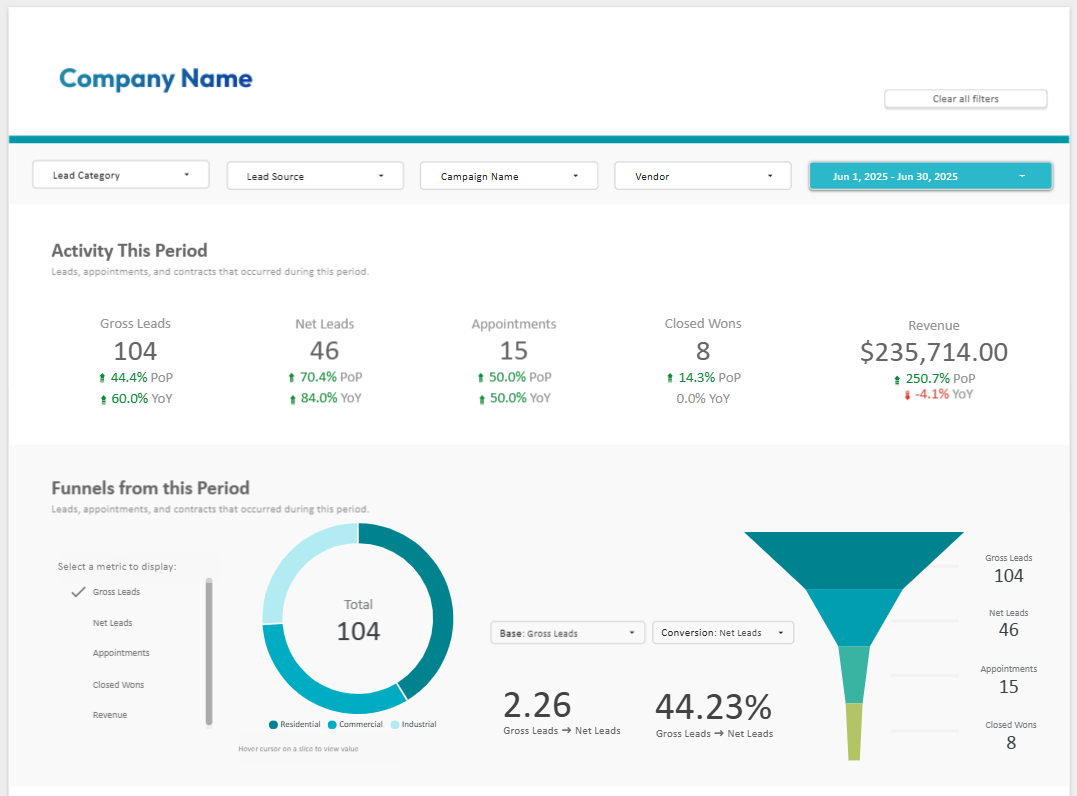
Explore this workshop report dashboard below to see the full participant journey from campaign reach to revenue. Built in Data Studio (formerly Looker Studio), you can track engagement at each funnel stage and pinpoint exactly where drop-off is happening.
Our Workshop Report Process
This workshop report outlines how participant engagement and conversion data is collected, organized, and analyzed across each stage of the funnel. It begins with gathering data from event campaigns and registration platforms, followed by cleaning and structuring to ensure accuracy and consistency. The prepared data is then analyzed to measure key funnel metrics, identify drop-off points, and evaluate overall performance from initial reach to final revenue. Insights are presented through an interactive dashboard, enabling stakeholders to clearly understand participant behavior and optimize future workshop strategies.
Campaign and Registration Data Collection
Data Cleaning and Structuring
Funnel Metric Analysis
Drop-Off Point Identification
Dashboard Visualization and Optimization Insights
More Dashboards
Smarter Spreadsheet Automation
Automated Access Management
Integrations Report
Marketing Analytics Report
Workshop Report
Churn Analysis Report
Sales and Operations Report
Real Estate Report
Frequently Asked Questions
A workshop report tracks the full participant journey, from initial campaign reach through registration, attendance, and final revenue; giving event organizers visibility into how participants move through each stage of the funnel.
By comparing conversion rates between each funnel stage, this workshop report pinpoints exactly where engagement drops, whether that's at registration, no-shows at the event itself, or missed follow-up after the workshop ends.
While built on past event data, the drop-off points and engagement patterns it surfaces directly inform what to adjust for future workshops; whether that's campaign targeting, registration friction, or event format.
Both, the report tracks revenue alongside engagement metrics at every funnel stage, so organizers can see not just whether a workshop was profitable, but how participants engaged with it along the way.
The dashboard is built in Data Studio (formerly Looker Studio), connecting campaign and registration data into one filterable view. It gives organizers a clear picture of funnel performance without manually combining data from separate event platforms.
Want to Know Where Participants Are Dropping Off?
Get a clear view of your full event funnel, from reach to revenue.
If you're running workshops but can't tell where participants disengage, we'll build you a workshop report that tracks every funnel stage, so your next event is backed by data, not guesswork.
Let's Talk