
Figure 1. This image is AI generated
Why Is Business Forecasting Important?
Business forecasting is the process of making informed predictions about future business outcomes by analyzing past data and identifying patterns. Organizations use forecasting to support financial and operational decisions and to guide business strategy. Forecasts provide estimates rather than exact results and allow decision-makers to evaluate potential outcomes.
Businesses generate large amounts of data every day, but data alone does not answer one of the most important questions: what is likely to happen next. Whether it is revenue, customer demand, or operational metrics, having a clear view of future trends helps teams prepare and make better decisions.
This is where business forecasting plays a role. With tools like BigQuery Data Canvas, analysts can work directly with their datasets and build forecasts in a structured environment. Platforms like these make it possible to analyze historical data and generate projections within the same system where the data is stored.
Business Forecasting in BigQuery Data Canvas
BigQuery is a fully managed, serverless data platform that allows organizations to store and analyze large amounts of data without managing infrastructure. It supports both structured and unstructured data and allows users to run queries using SQL, with Python supported through integrated notebook environments. Its architecture separates storage and compute, allowing data to be stored and analyzed efficiently without resource conflicts.
Figure 2. This image is AI generated
BigQuery Data Canvas is a feature in BigQuery that allows analysts to find, query, transform, and visualize data using a graphical interface and natural language prompts. It presents analysis workflows in a visual format, allowing datasets and query results to be explored within the same workspace. Data Canvas can also generate SQL queries, charts, and summaries, making it easier to move from raw data to insights. It also allows workflows to be exported as notebooks that support Python, which can be used for business forecasting and other analytical tasks.
Discovering Business Forecasting
In my role as a Data and Operations Analyst, much of my work involved maintaining reports and ensuring that key performance metrics were accurate and accessible. These reports were useful for understanding what had already happened, but over time, it became clear that retrospective analysis alone was not enough. Operational planning often required answers to forward-looking questions, such as how performance might change in the coming months or whether current trends were likely to continue.
This led me to explore business forecasting as a way to extend the value of existing datasets. Rather than treating data as a static record, forecasting made it possible to use historical patterns to estimate future outcomes. Since the data infrastructure was already available in BigQuery, it was natural to explore how forecasting could be performed directly within that environment. BigQuery Data Canvas provided a structured workspace where datasets could be organized without requiring constant data movement between platforms.
As I worked through this process, I learned how important data preparation and consistency were for producing meaningful forecasts. Structuring time-based records correctly and maintaining reliable historical data played a major role in generating usable projections. Over time, forecasting became less of an abstract concept and more of a repeatable workflow. It allowed data to support planning in a more proactive way.
My Experience with Business Forecasting
Business forecasting relies on historical data, and its accuracy improves as more consistent records become available. Earlier in my work with BigQuery, I explored Data Canvas to understand how forecasting workflows could be performed within the BigQuery environment. Through that experience, I learned how historical data could be prepared, how simple forecasting models could be applied, and how the results could be integrated back into the data environment. These early lessons became the foundation for forecasting workflows now used in current analytical projects. To share how that process works, the following section presents a hypothetical example using sample revenue data to demonstrate basic business forecasting in BigQuery.
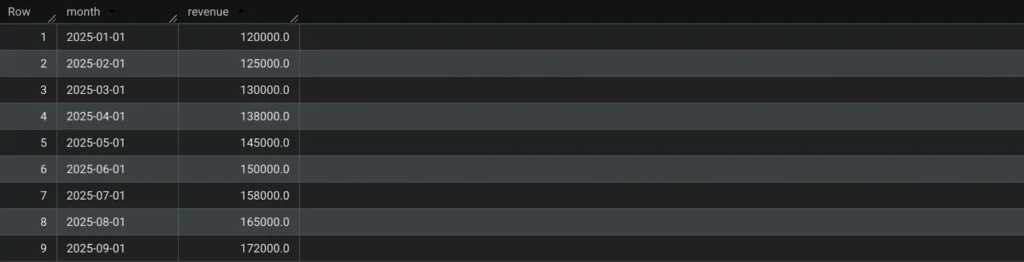
Context 1: Assume there is a table in BigQuery containing monthly revenue data for a franchise location called “Branch A.”
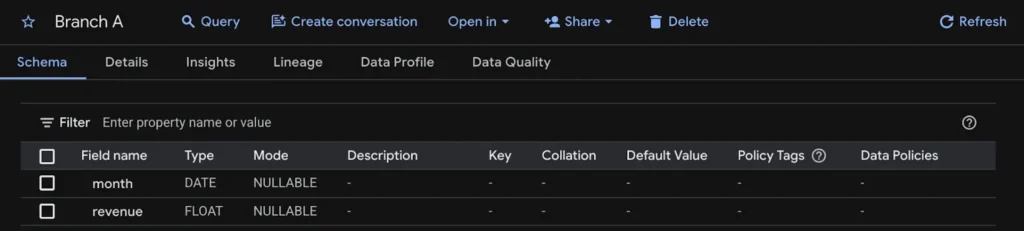
Context 2: The table contains revenue values from January to September 2025, representing three completed quarters. The objective is to perform business forecasting to estimate revenue for the fourth quarter of 2025.
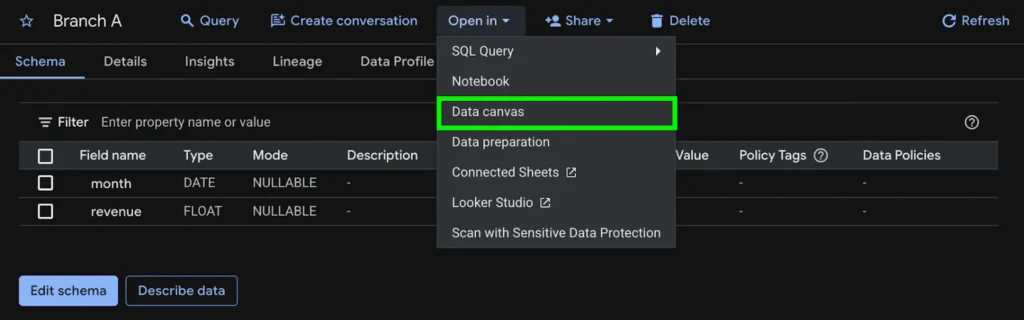
Step 1: In the table view inside BigQuery, click “Open in” in the menu bar and select “Data Canvas.” This loads the selected table in the Data Canvas interface.
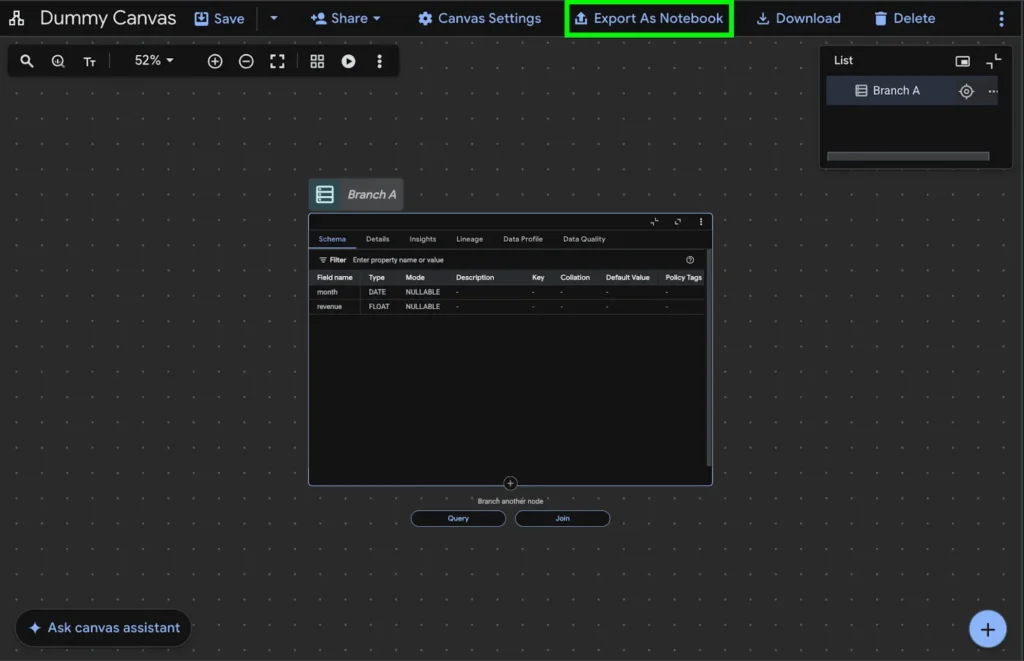
Step 2: The table will appear in Data Canvas as a node representing the source dataset. Click “Export as Notebook” in the menu tab to create a notebook version of the workflow that supports Python-based forecasting.
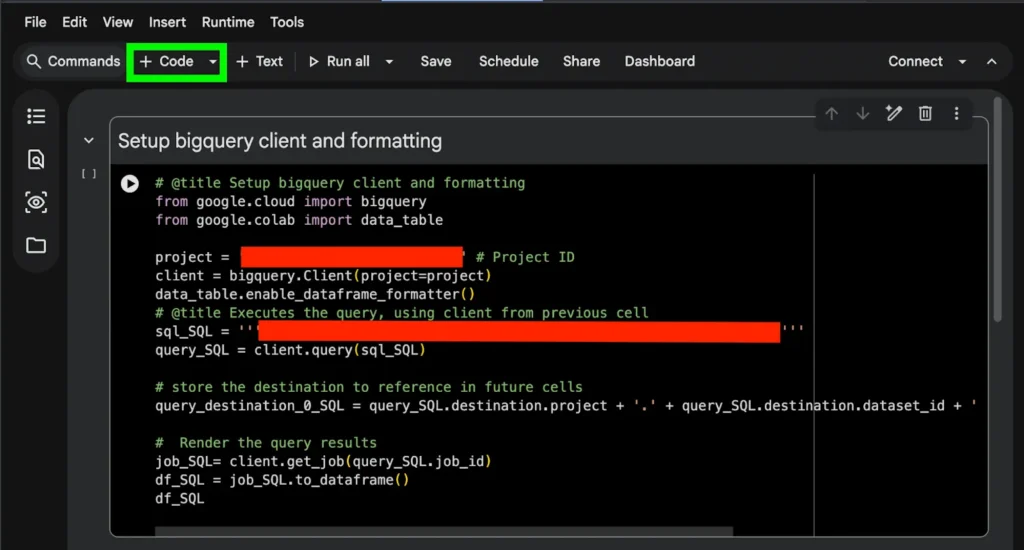
Step 3: After selecting “Export as Notebook,” a prompt will appear to name the notebook and enable required APIs. After completing these steps, the notebook will open. The first code cell contains inspection code that displays the dataset schema when executed. Click “+ Code” in the menu bar to insert a new code cell, which will be used for the forecasting code.
Step 4: Exponential Smoothing can be used for a simple business forecasting example. For larger datasets with seasonal or trend components, more advanced models such as ARIMA or SARIMA may be appropriate. Click the “Generate” button to begin generating forecasting code.

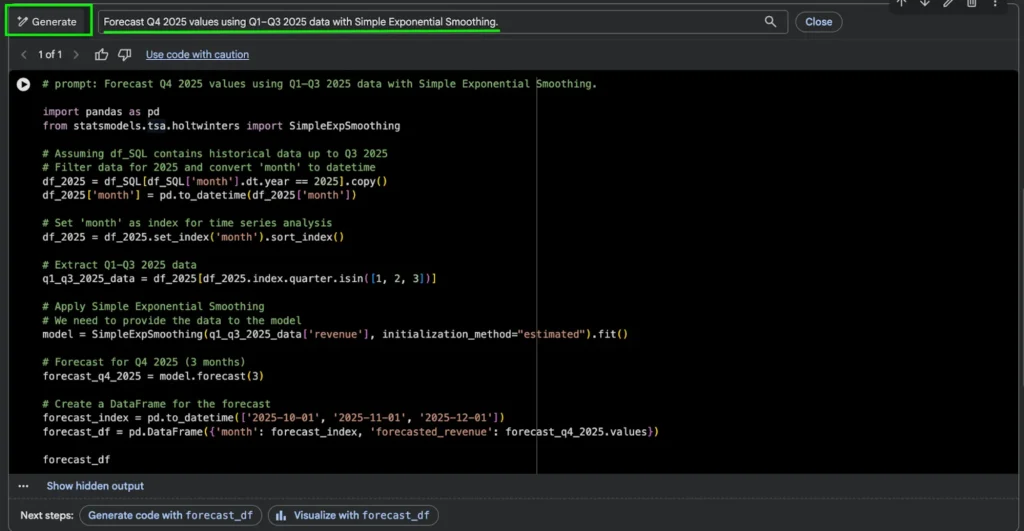
Step 5: Select “Generate with AI” and enter a command describing the forecasting task. For example, input “Forecast Q4 2025 values using Q1–Q3 2025 data with Simple Exponential Smoothing.” Submit the prompt, and Gemini will generate the corresponding Python code for forecasting.
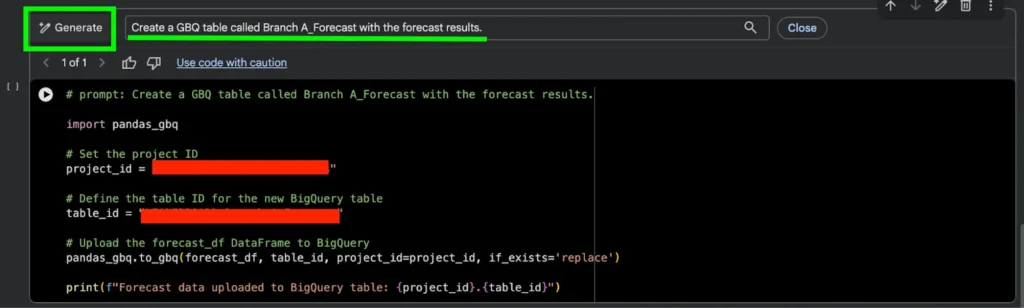
Step 6: Insert another code cell below the forecast code. Enter a prompt such as “Create a GBQ table called Branch_A_Forecast with the forecast results.” Gemini will generate code that creates a destination table and saves the forecast output.
Step 7: Click “Run All” in the notebook menu bar to execute each code cell sequentially. This runs the inspection code, generates the forecast, and creates the destination table in BigQuery.

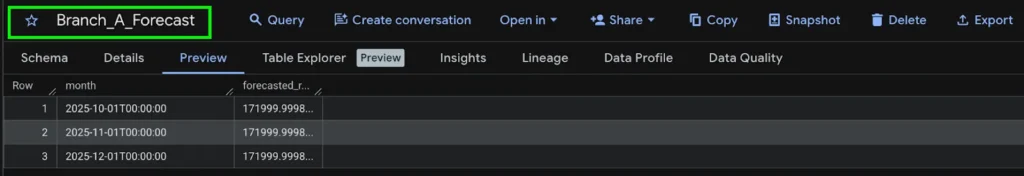
Step 8: Open the target project and dataset in BigQuery to confirm that the new table, “Branch_A_Forecast,” has been created. The table should contain forecasted revenue values for October through December 2025.
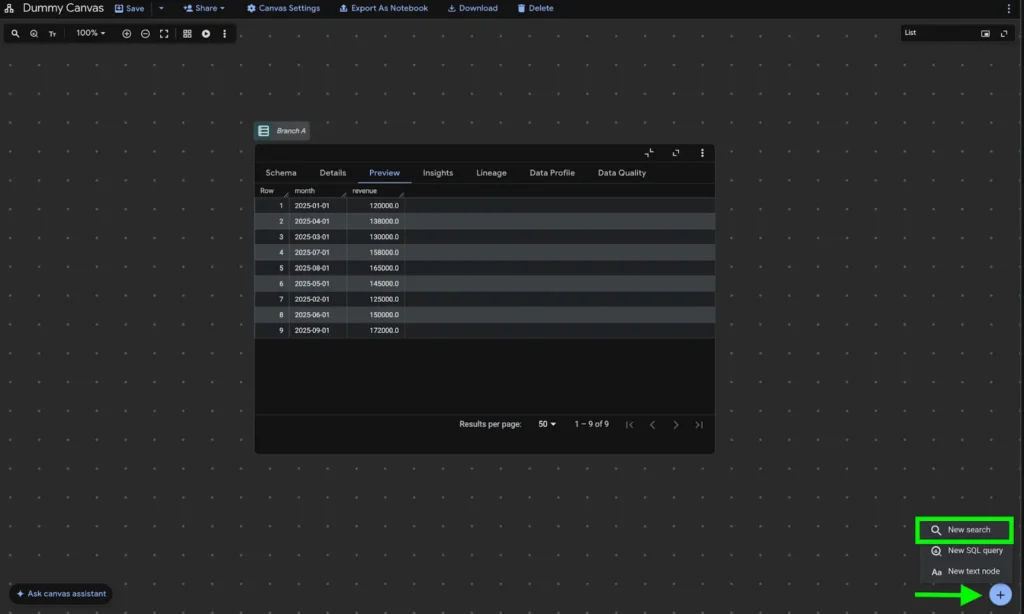
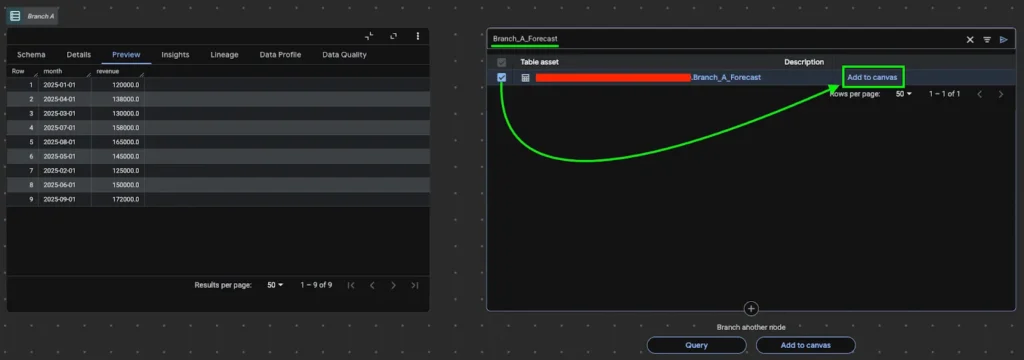
Step 9: Return to the Data Canvas tab and click the “+” button in the lower corner. Select “New Search” to locate additional tables within the project.
Step 10: Enter “Branch_A_Forecast” in the search field. Once the table appears in the results, select it and click “Add to canvas” so it becomes part of the workflow.
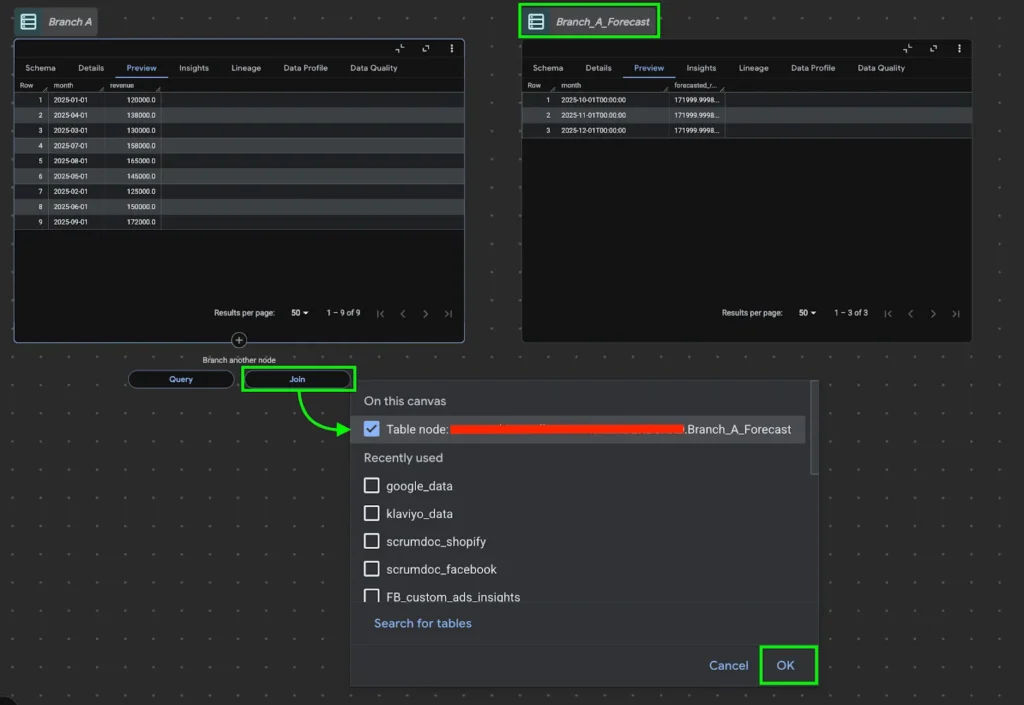
Step 11: The forecast table will appear as a new node in Data Canvas. Click the “Join” option below the original “Branch A” table and select the forecast table, then confirm to create a connection between the datasets.
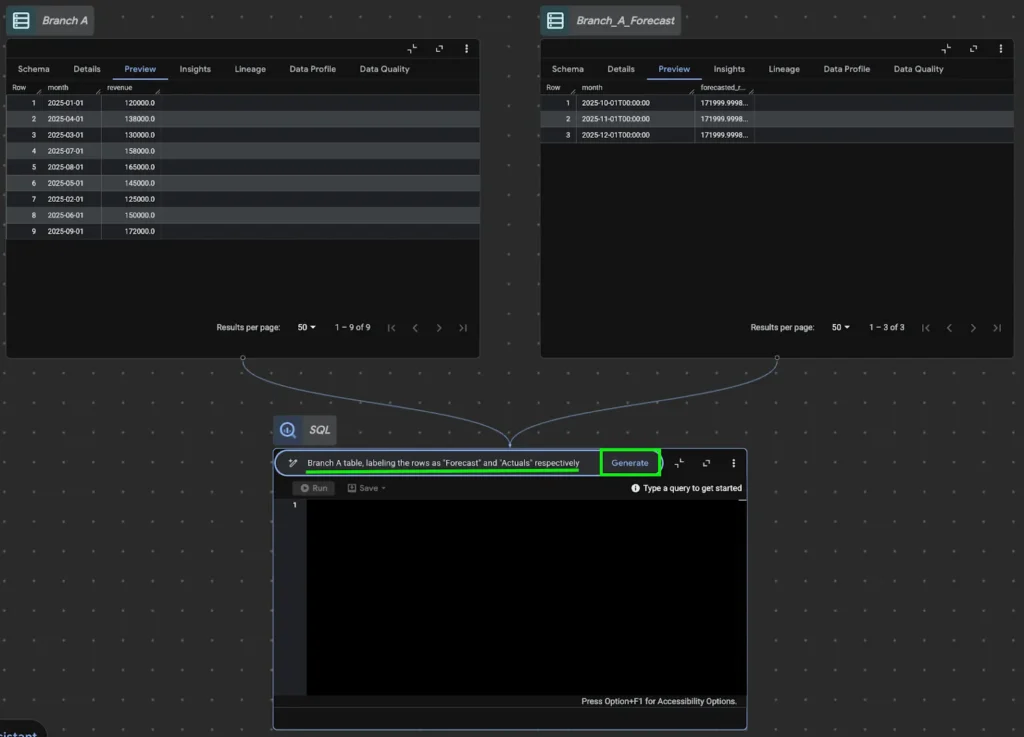
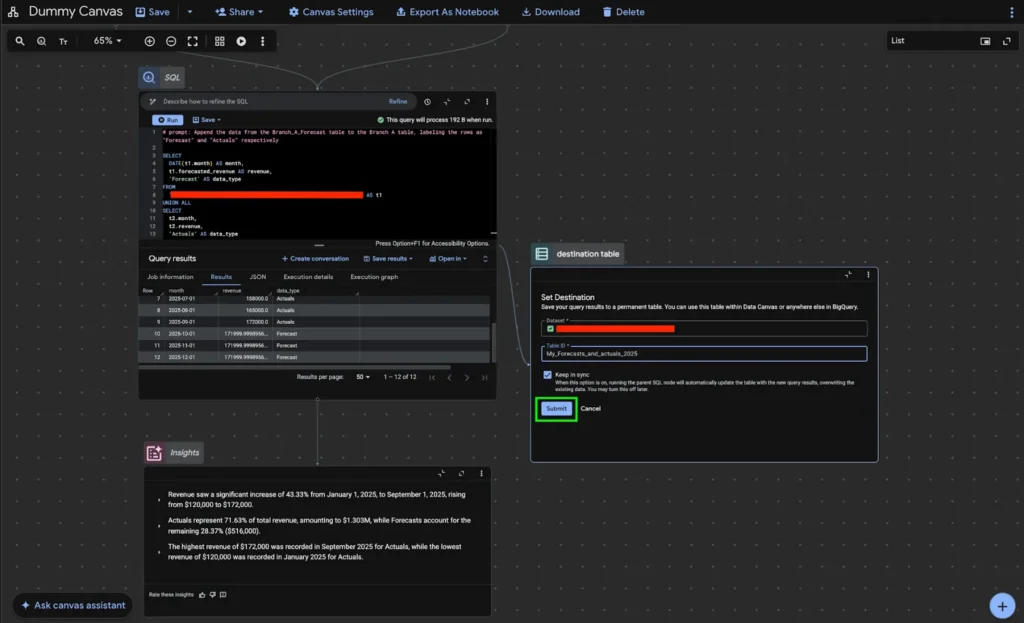
Step 12: A new node will appear showing the relationship between the two tables. Remove the default query and enter a prompt such as “Append the data from the Branch_A_Forecast table to the Branch A table, labeling the rows as ‘Forecast’ and ‘Actuals’ respectively.” Generate the SQL code to combine the datasets.
Step 13: Run the generated query to append the forecast data to the historical records. The preview panel will display a unified table containing both actual and forecast values. The “Generate Insights” option can also produce an initial interpretation of the combined data.
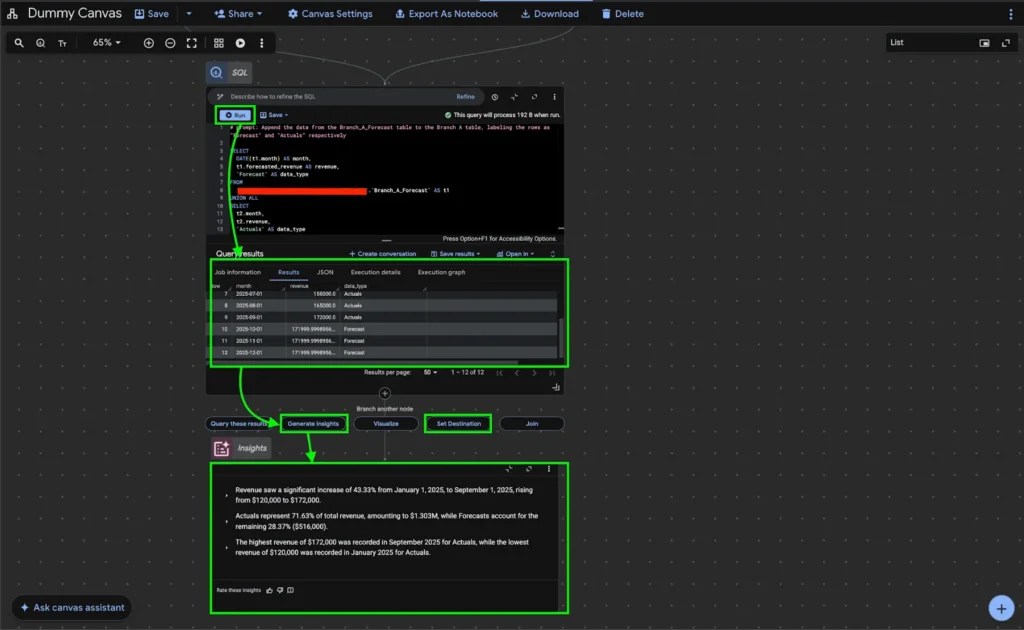
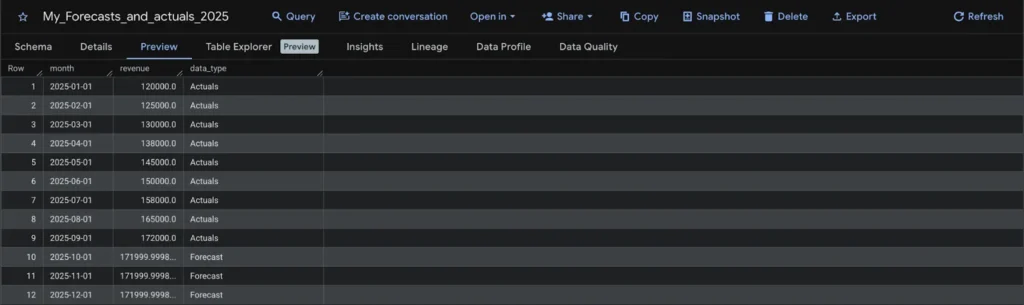
Step 14: Click “Set Destination” to save the combined results as a permanent table. Select the dataset and assign a name such as “My_Forecasts_and_actuals_2025.” Enabling “Keep in Sync” ensures the table updates automatically whenever the workflow runs.
Step 15: Open BigQuery Studio and verify that the destination table has been successfully created. This table now contains both historical and forecasted values, completing the business forecasting workflow within BigQuery Data Canvas.
End: This implementation demonstrates how business forecasting can be performed within BigQuery using Data Canvas and its notebook integration. Actual implementations may vary depending on data volume, forecasting model, and operational requirements, but the same workflow foundation applies when building reliable forecasting systems.
And that concludes this example of implementing business forecasting using BigQuery Data Canvas. This workflow shows how historical data can be prepared, forecasted, and integrated back into the data environment to support structured analysis.
Knowing how to use forecasting tools is only the first step. The real value comes from applying them correctly to real-world data and translating projections into meaningful direction. If managing large datasets or building reliable forecasts is a challenge, having the right analytical support can make a significant difference.
From Statistical Consulting for Research that helps ensure proper analytical structure, to dedicated Data Analysis that converts complex datasets into clear and usable insights, our team supports organizations in strengthening their data and forecasting capabilities. Our goal is simple: to help teams move forward with clarity and confidence.