
Integrations Report
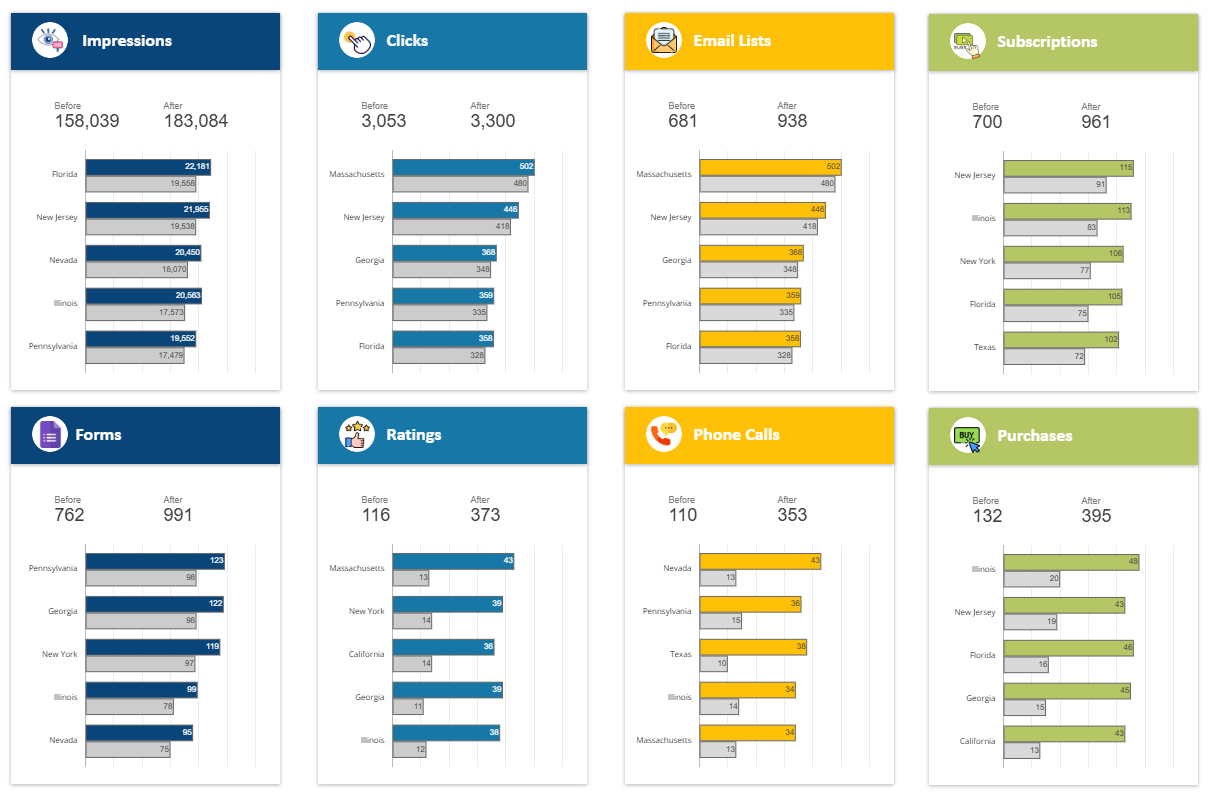
Report Overview
This integrations report enables businesses to evaluate the effectiveness of newly implemented systems by analyzing pre- and post-integration performance data. It examines key touchpoints such as clicks, form submissions, subscriptions, and purchases to identify meaningful changes in user behavior and conversion outcomes. By combining data analysis with clear visual reporting, the project reveals trends and performance insights that may otherwise go unnoticed. Enables businesses to measure ROI with greater accuracy, identify opportunities for optimization, and make strategic decisions for future technology investments.
Business problem
After rolling out new systems, the business had no clear way to tell whether the change actually improved performance.
What we built
A before-and-after integrations dashboard that compares pre- and post-integration data across key touchpoints.
How it works
- Pre- and post-integration data is consolidated for each touchpoint — clicks, form submissions, subscriptions and purchases.
- Looker Studio (Data Studio) visualizes the change side by side.
- Stakeholders read ROI at a glance instead of assembling it by hand.
Business impact
Integration reviews that previously took roughly two days of manual analysis now take minutes.
Dashboard Results and Performance
Explore the interactive dashboard below to see exactly how performance shifted before and after the integration. Built in Data Studio, you can use the filters to compare touchpoints like clicks, form submissions, subscriptions, and purchases, and adjust the date range to see how the impact held up over time.
Our Integrations Report Process
The process starts with gathering pre- and post-integration data across key touchpoints, including clicks, submissions, subscriptions, and purchases. This data is cleaned, structured, and prepared for analysis to ensure accuracy and consistency. A comparative approach is then used to evaluate performance changes and measure the impact of system integration. The result is an integrations report that doesn't just show what changed, but why; visualized through structured reports that highlight trends, patterns, and key insights for clear, informed decision-making.
Data Collection and Requirements
Data Cleaning and Preparation
Comparative Analysis
Visualization and Reporting
Strategic Recommendations
More Dashboards
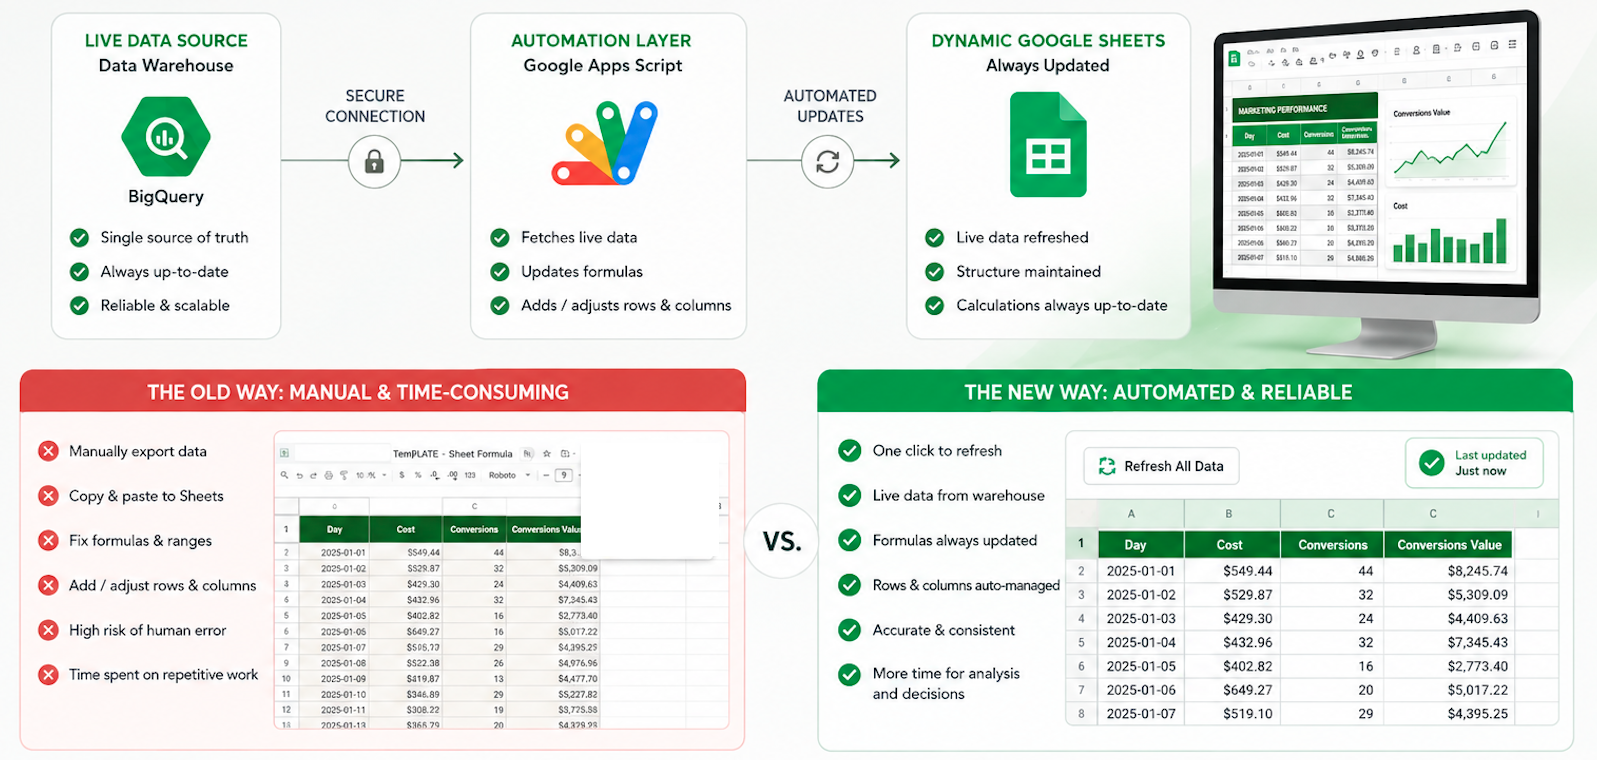
Smarter Spreadsheet Automation
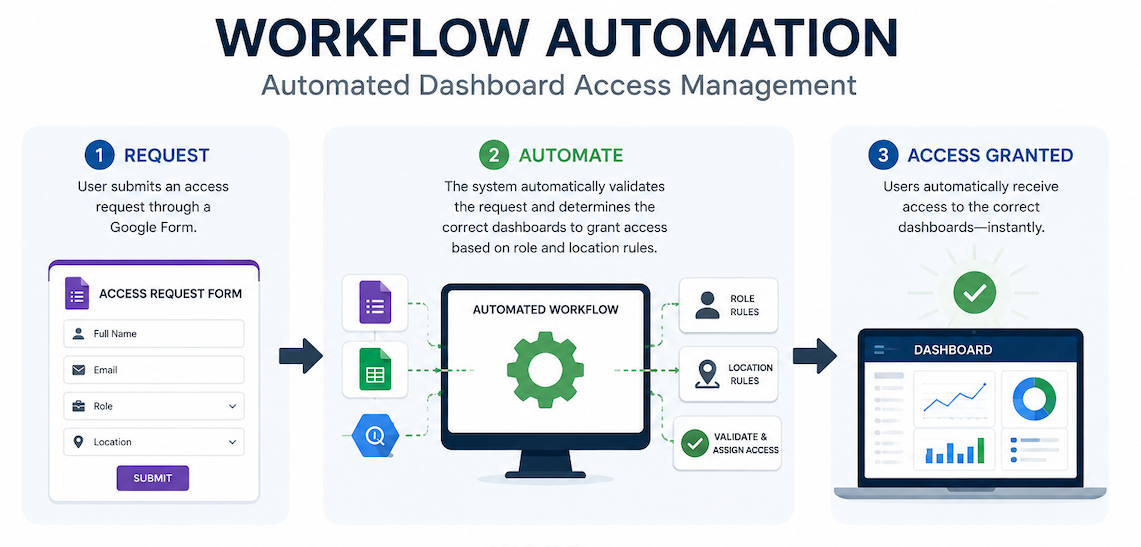
Automated Access Management
Integrations Report
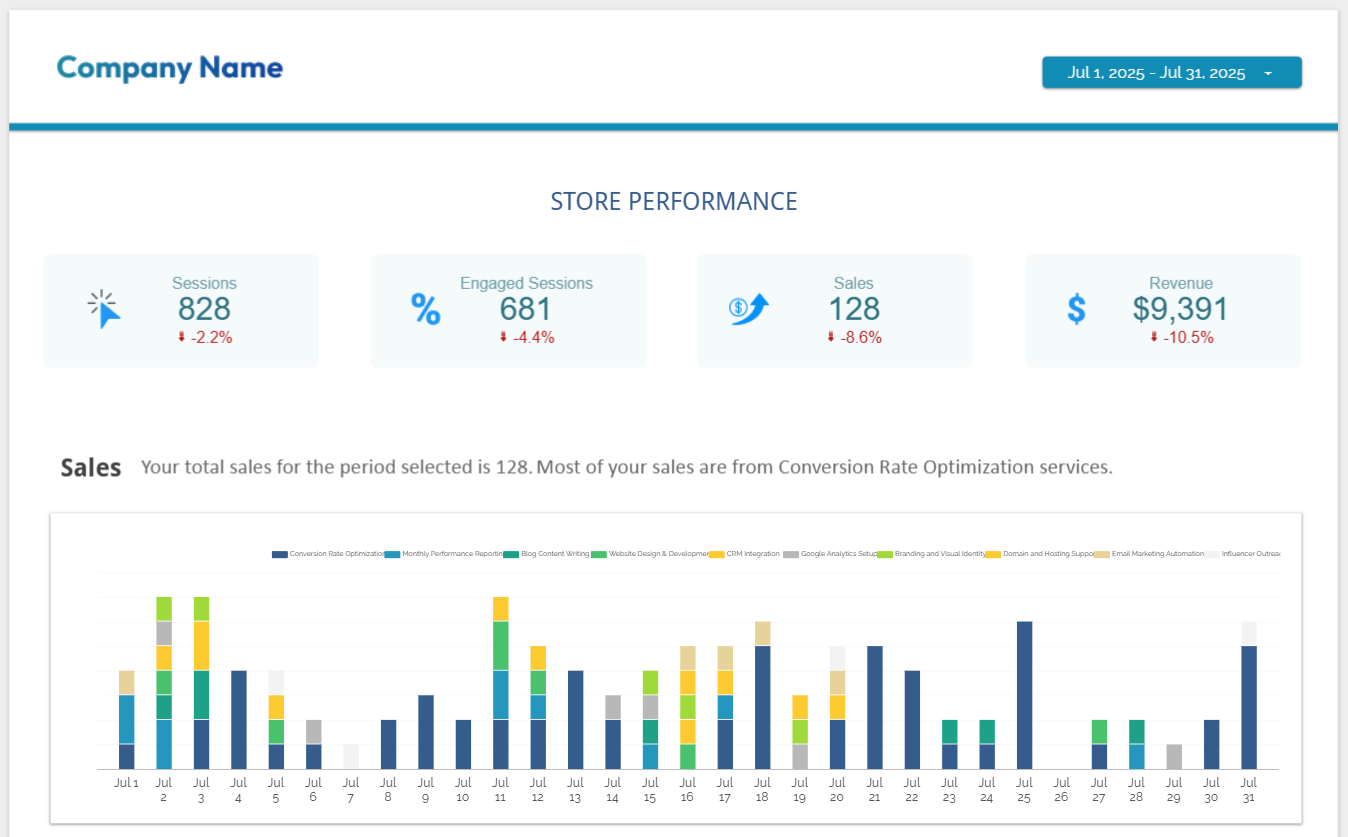
Marketing Analytics Report
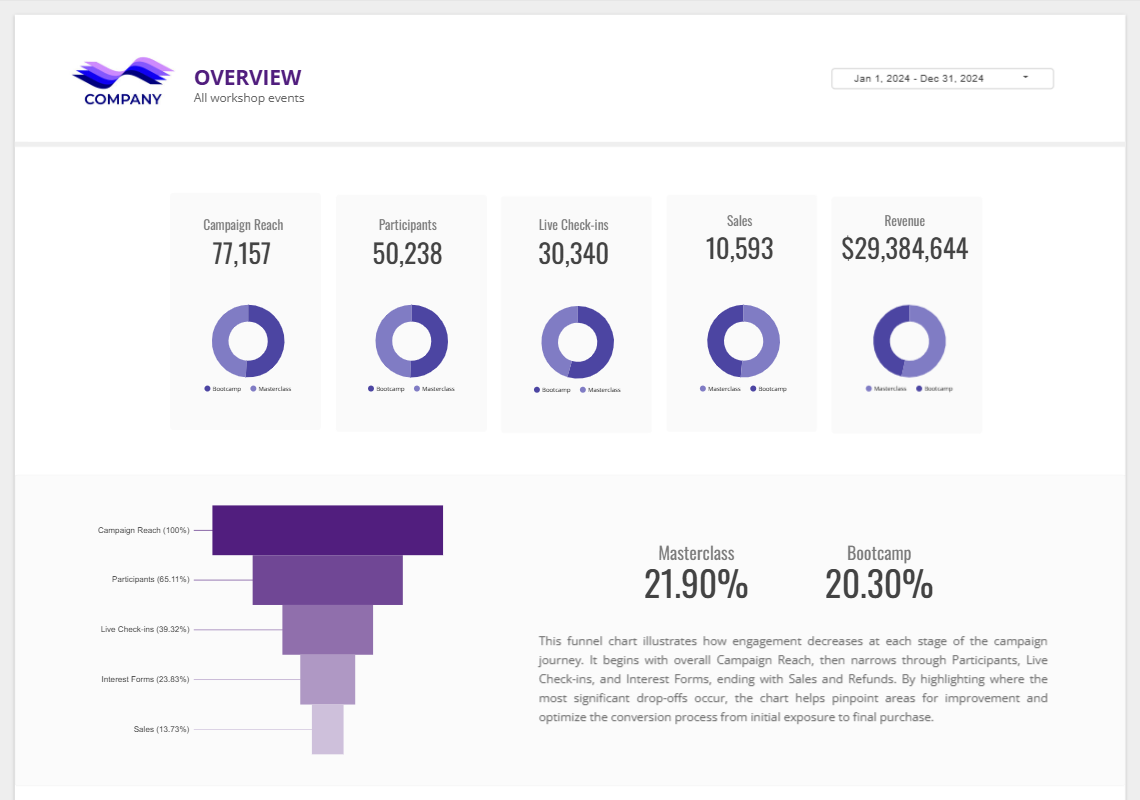
Workshop Report
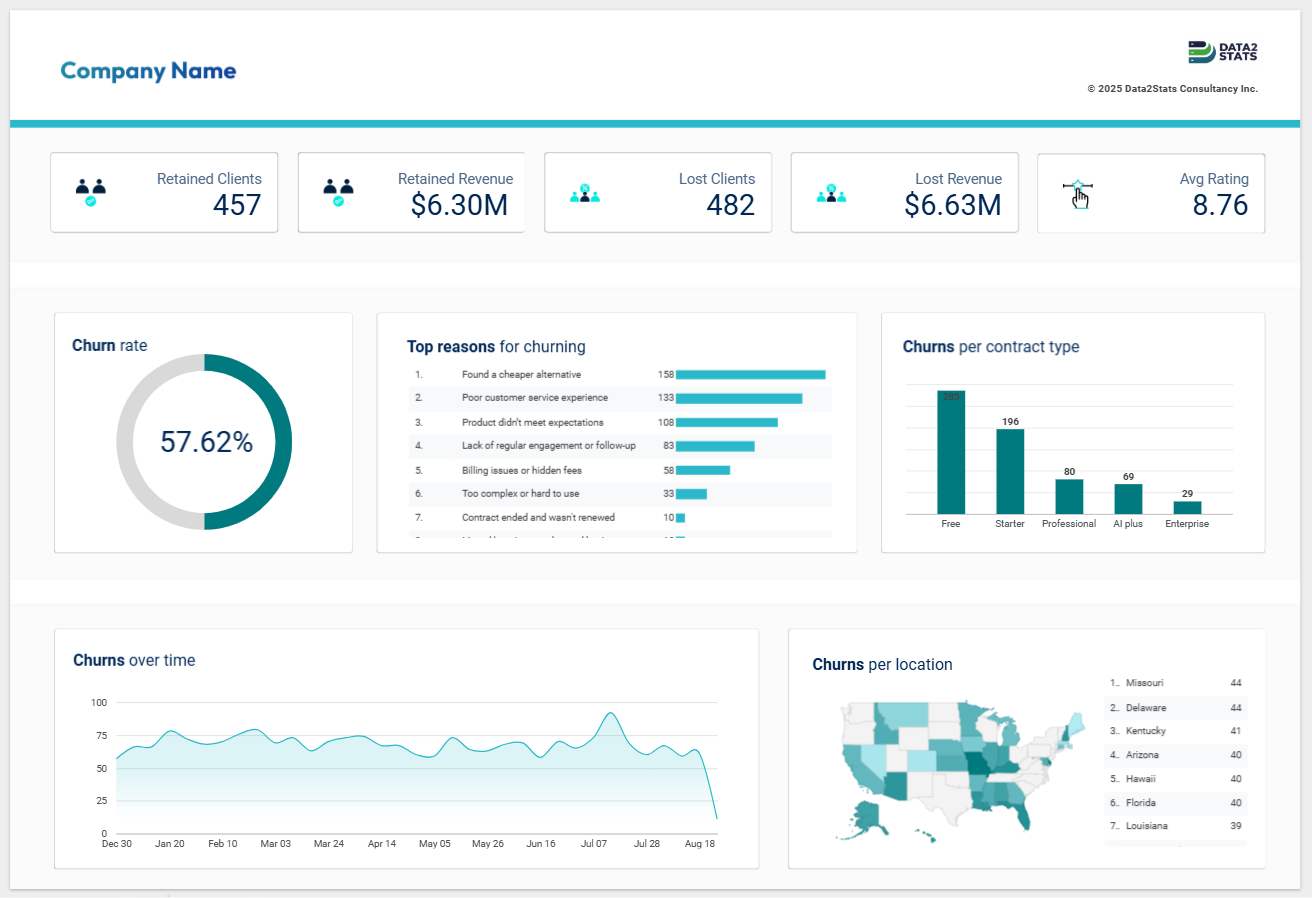
Churn Analysis Report
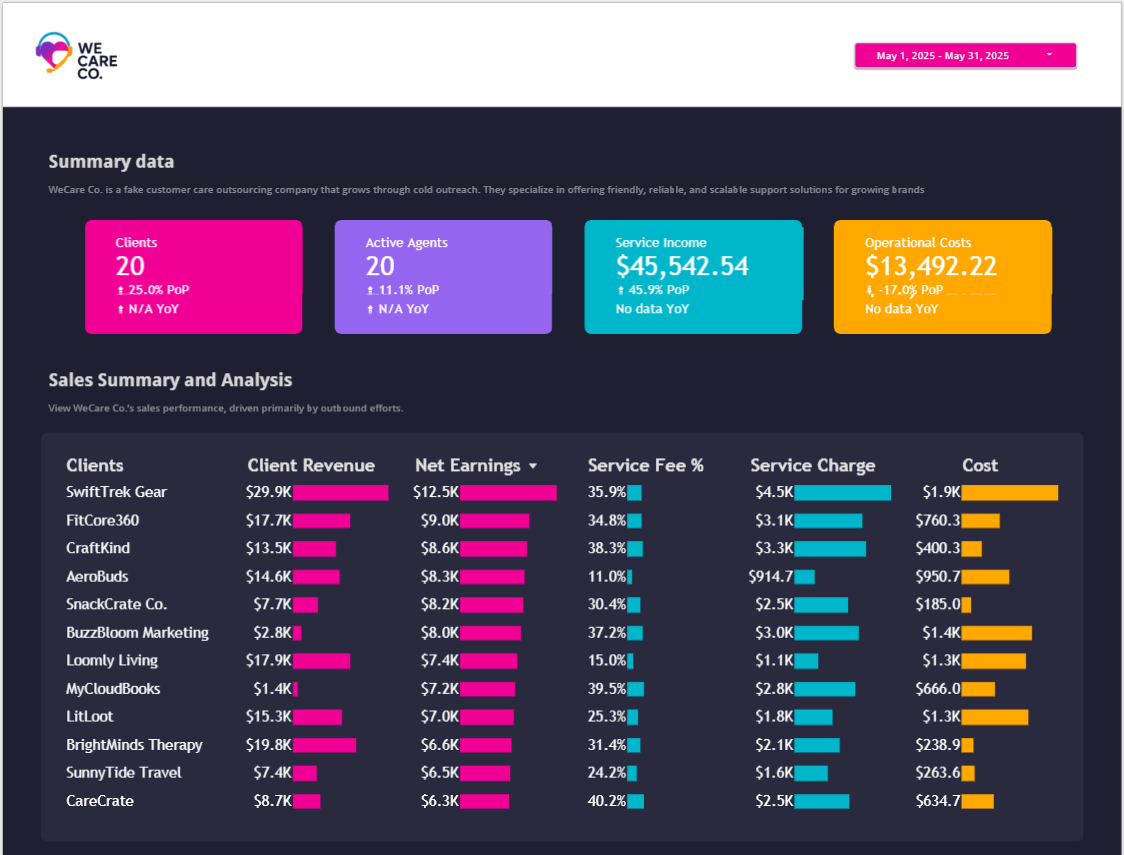
Sales and Operations Report
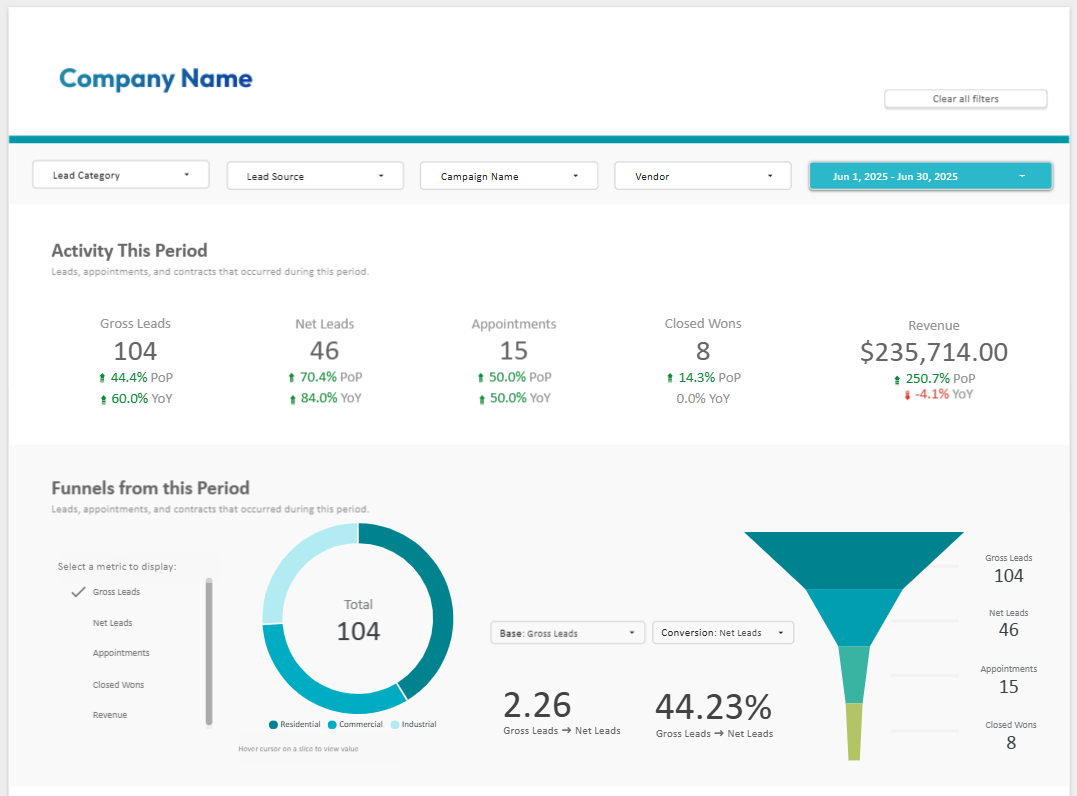
Real Estate Report
Frequently Asked Questions
Briefly explain it measures how a new system/tool integration actually performed; not just that it launched, but whether it moved the needle on user behavior.
Explain the pre- vs. post-integration comparison approach; same metrics, same time window, before/after the integration went live.
Clicks, form submissions, subscriptions, purchases; the touchpoints already mentioned in your "Our Process" section.
Even a rough range (e.g., "typically 30–90 days of post-launch data") gives visitors a concrete expectation and is the kind of specific answer that performs well in featured snippets.
We build the dashboard in Data Studio (formerly Looker Studio), pulling in the cleaned pre- and post-integration data so it can be filtered and explored directly. It lets clients compare touchpoints like clicks, form submissions, and purchases side by side without digging through a static spreadsheet.
Reassures prospective clients this isn't a one-off, narrow case study; it's a repeatable service.
Want Your Own Integrations Report?
Turn your before-and-after performance data into a clear, decision-ready report.
Whether you've just launched a new platform or you're planning one, we'll help you measure its real impact with a custom dashboard built around your own data; so your next technology decision is backed by evidence, not guesswork.
Get Your Custom Report