
Churn Analysis Report
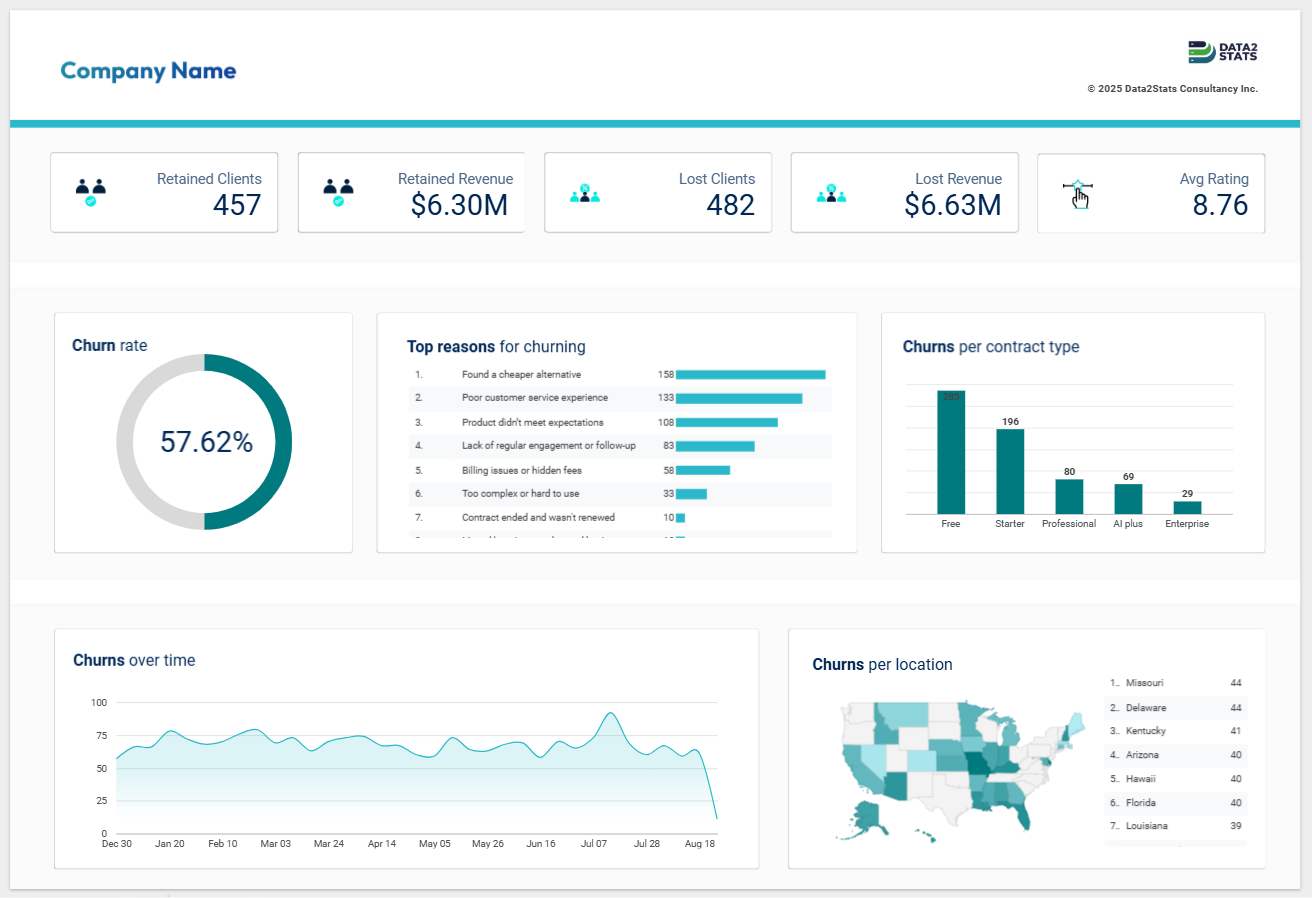
Report Overview
This Churn Analysis Report provides a comprehensive view of customer retention by examining patterns and trends in client behavior. It highlights key indicators of churn, including engagement levels, usage patterns, and historical data, to better understand why customers leave.
The report enables businesses to identify high-risk segments, monitor retention performance, and uncover the main drivers of churn. By presenting insights through an interactive dashboard, it supports data-driven strategies to improve customer retention and reduce overall attrition.
Business problem
The business could not clearly see why customers were leaving or spot who was at risk.
What we built
A churn analysis dashboard that surfaces retention patterns and the key indicators behind customer churn.
How it works
- SQL models engagement, usage and historical data to flag churn indicators.
- Google Sheets and Looker Studio (Data Studio) turn it into a clear view.
- At-risk patterns become visible early.
Business impact
At-risk customers surfaced an estimated several weeks earlier than manual review allowed.
Dashboard Results and Performance
Explore this churn analysis report dashboard below to see customer retention trends, high-risk segments, and key churn drivers in one place. Built in Data Studio (formerly Looker Studio), you can filter by segment or date range to pinpoint where attrition is concentrated and what's driving it.
Our Churn Analysis Report Process
This churn analysis report outlines how customer data is collected, prepared, and analyzed to identify churn patterns and retention trends. It begins with gathering historical and behavioral data, followed by cleaning and structuring to ensure accuracy and consistency. The prepared data is then analyzed to detect high-risk segments, evaluate key churn indicators, and uncover the underlying drivers of customer attrition. Insights are presented through an interactive dashboard, enabling businesses to implement effective retention strategies.
Historical and Behavioral Data Collection
Data Cleaning and Structuring
Churn Pattern and Risk Segmentation
Key Driver Analysis
Dashboard Visualization and Retention Strategy
More Dashboards
Smarter Spreadsheet Automation
Automated Access Management
Integrations Report
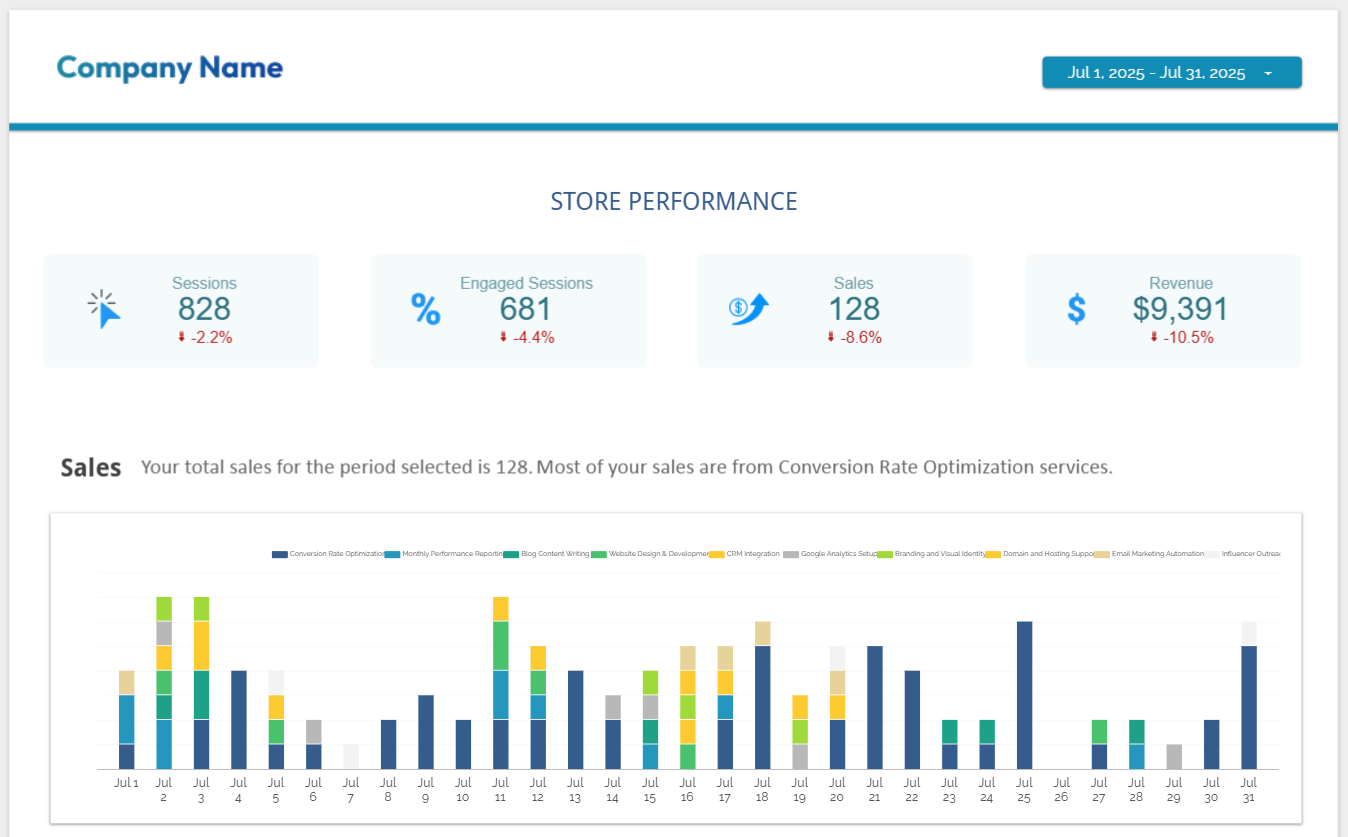
Marketing Analytics Report
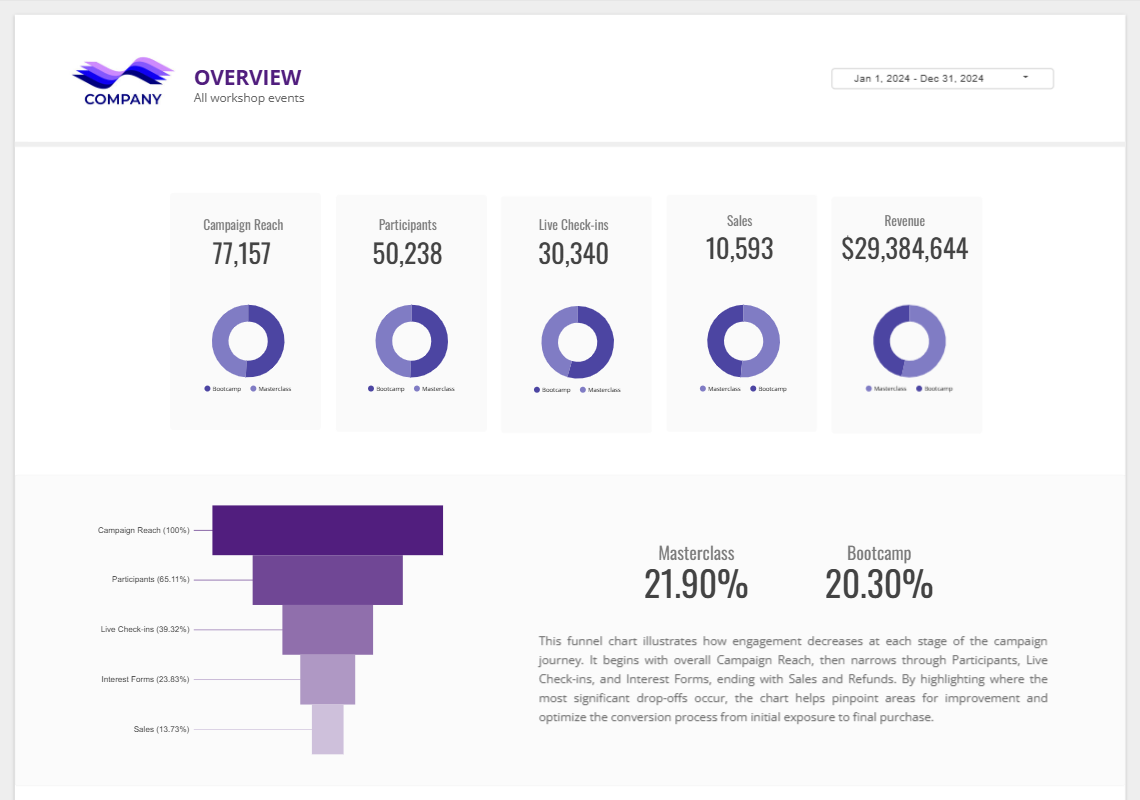
Workshop Report
Churn Analysis Report
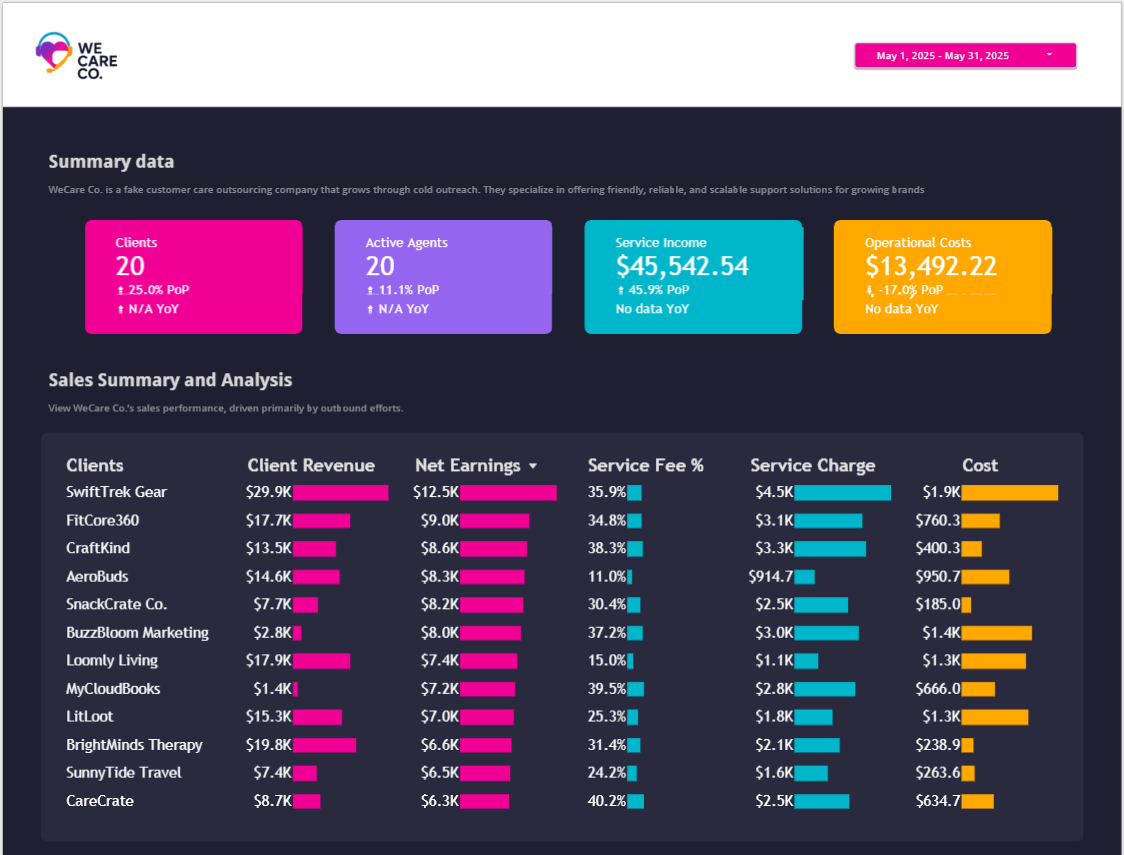
Sales and Operations Report
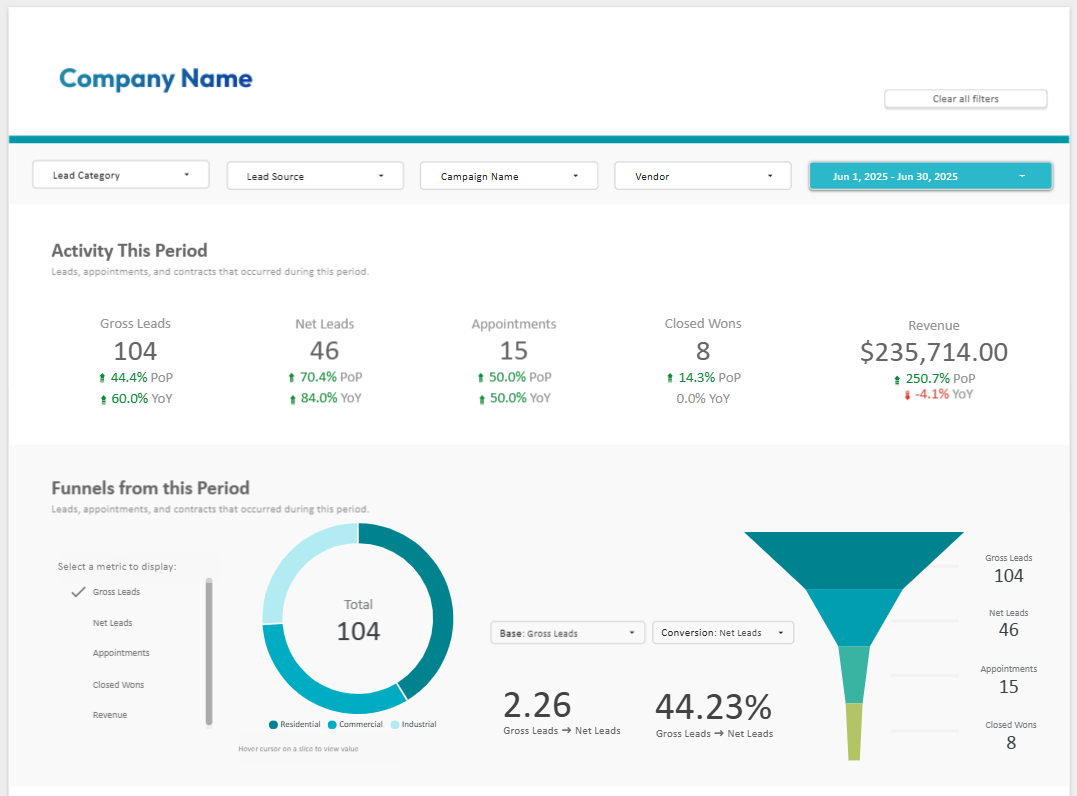
Real Estate Report
Frequently Asked Questions
A churn analysis report examines customer behavioral data; engagement levels, usage patterns, and account history, to identify why customers are leaving and which segments are at the highest risk of attrition, so businesses can act before they lose them.
We segment customers by behavioral indicators like declining engagement or usage drop-off, then group them by risk level. This churn analysis report surfaces the highest-risk segments clearly so retention efforts can be prioritized where they'll have the most impact.
Churn rate shows how fast customers are leaving; customer lifetime value shows how much each customer relationship is worth over time. Tracking both together in a churn analysis report shows not just that you're losing customers, but what that loss is actually costing the business.
The report is primarily retrospective; it uses historical and behavioral data to identify patterns and drivers. However, the risk segments and indicators it surfaces provide a solid foundation for building predictive models as a next step.
The dashboard is built in Data Studio (formerly Looker Studio), with data prepared in Google Sheets and SQL. It connects behavioral and historical customer data into one interactive view that can be filtered by segment, time period, or risk level.
Not Sure Why Your Customers Are Leaving?
Find the patterns before attrition becomes a bigger problem.
If you're seeing customer drop-off but can't pinpoint where or why, we'll build you a churn analysis report that surfaces the behavioral patterns, high-risk segments, and key drivers behind your attrition; so your retention strategy is built on data, not guesswork.
Let's Talk