Introduction
Research often involves more than just collecting information. In many cases, the challenge comes from understanding what the data actually means and identifying patterns that may not be immediately visible at first glance. This is especially true when working with qualitative data, where responses are usually detailed, open-ended, and highly varied from one participant to another.
To address this, researchers use different methods to organize and interpret qualitative information in a more structured way. One commonly used approach is thematic analysis, which helps researchers examine recurring ideas and patterns within a dataset. Because of its flexibility, it has become a widely used method across different fields of research and professional studies.
What is Thematic Analysis
Thematic analysis is a method used to analyze qualitative data by examining information collected through interviews, focus groups, surveys, and other textual or visual materials. It involves breaking down data into smaller and more manageable parts, often organized into codes, categories, and themes. Through this process, researchers can identify recurring patterns and develop interpretations based on the data they have gathered.
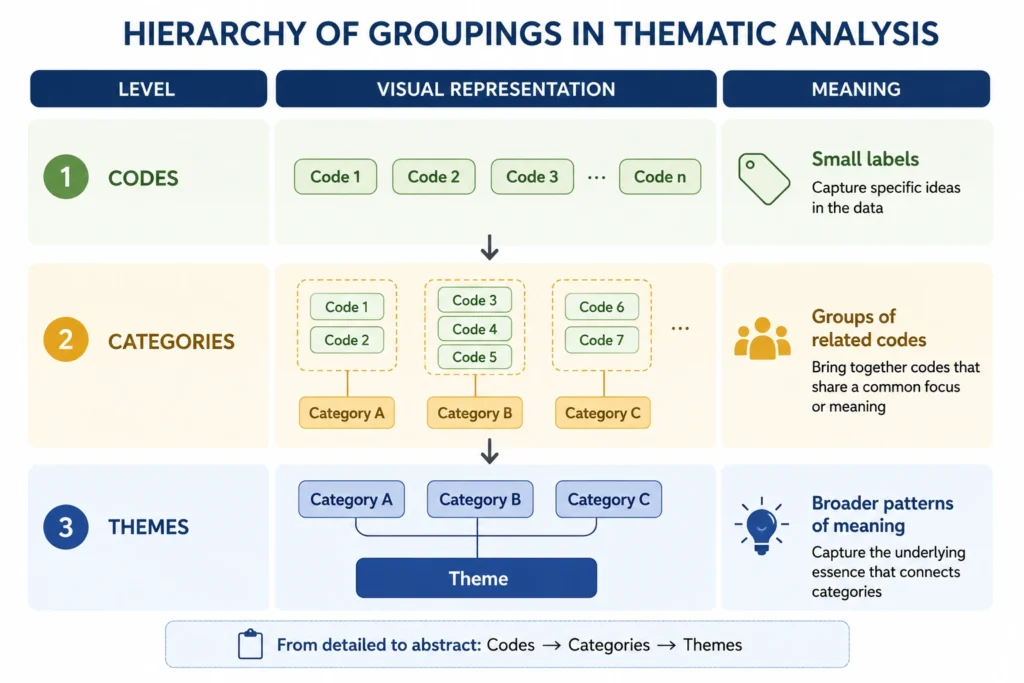
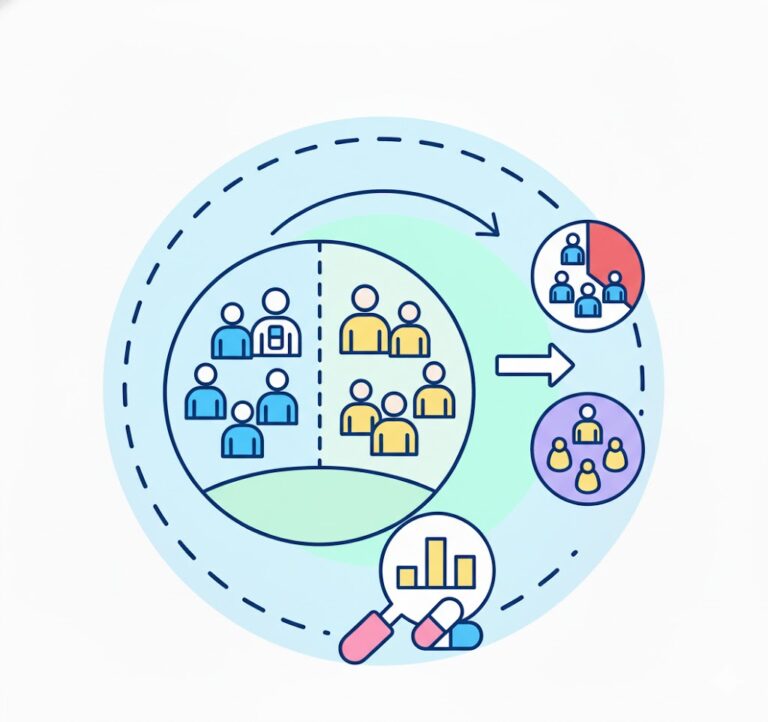
Figure 2. This image is AI generated
By organizing and contextualizing qualitative information, thematic analysis helps researchers build meaningful narratives and better understand experiences, behaviors, and perspectives related to their research objectives (see Figure 2). One reason for its widespread use is its versatility, as it can accommodate different types of qualitative data and research contexts. It is also considered accessible because it can be performed using simple methods like pen-and-paper coding or with the help of advanced qualitative and statistical software tools, including NVivo, ATLAS.ti, and MAXQDA.
How to Conduct Thematic Analysis
Thematic analysis follows a step-by-step process that transforms raw qualitative data into organized findings. The process usually begins by reviewing the collected responses and identifying significant statements that appear relevant to the study. These statements are often short excerpts that capture important experiences, opinions, concerns, or recurring ideas within the dataset. At this stage, the goal is not yet to interpret the entire dataset, but to isolate portions of the data that may contribute meaningful insights later in the analysis.
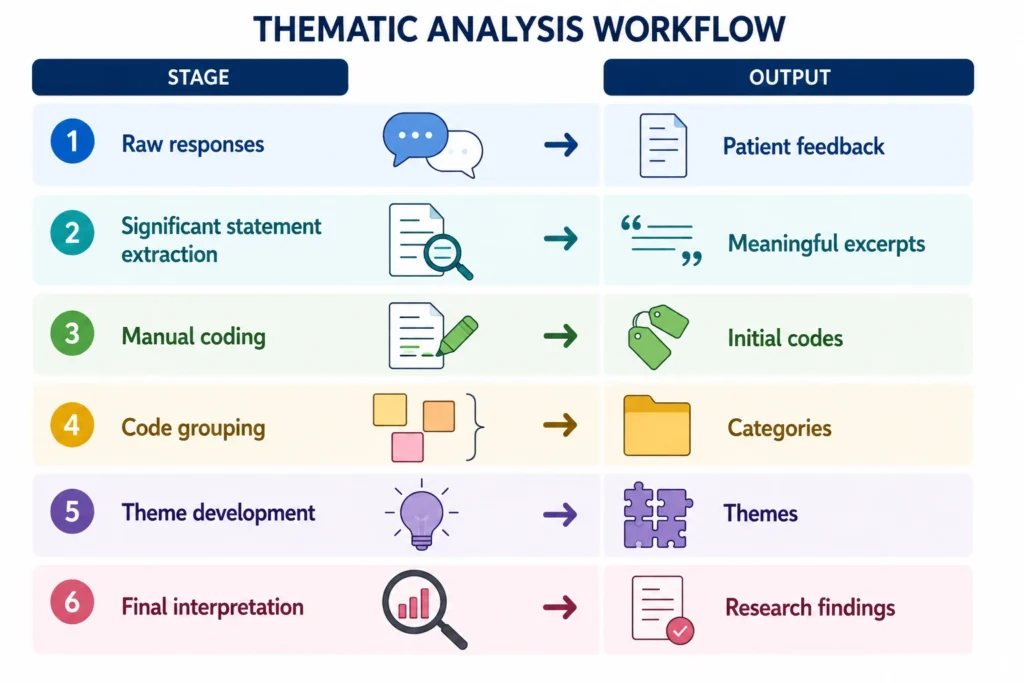
Figure 3. This image is AI generated
After extracting significant statements, researchers assign codes to each excerpt based on its meaning or underlying idea. Codes act as descriptive labels that help summarize the content of individual responses. Once multiple codes have been identified, similar or related codes are grouped together into broader categories to organize the dataset more systematically. Researchers then examine the relationships between these categories to develop themes within the thematic analysis process, which represent larger patterns that appear across the data. These themes are finally interpreted and connected back to the objectives of the study to produce the overall findings of the analysis.
Thematic Analysis Walkthrough Using Sample Data
To better understand how thematic analysis works, this section presents a simple example using patient feedback collected after hospital visits. The walkthrough will demonstrate how responses can be reviewed, coded, grouped, and organized into themes. For this example, Google Sheets was used to organize and analyze the responses, although the same process can also be done manually using pen and paper.
Stage 1: Reviewing Raw Responses
The first stage involves encoding or compiling the qualitative responses into a single organized dataset. In this example, the patient feedback was entered into Google Sheets with corresponding Response IDs for easier tracking and organization.
| Response ID | Patient Feedback |
| 1 | The doctor explained my condition clearly and was very kind. |
| 2 | Waiting time was too long but the staff were helpful. |
| 3 | I felt rushed during the consultation. |
| 4 | The clinic was clean and organized. |
| 5 | The nurse answered all my questions patiently. |
| 6 | Scheduling an appointment was difficult. |
| 7 | The doctor listened carefully to my concerns. |
| 8 | I waited almost two hours before being called. |
| 9 | Staff were friendly but communication was confusing. |
| 10 | Overall I had a comfortable experience. |
Once the responses have been compiled, the researcher reviews the dataset carefully to become familiar with the content before proceeding to the next stage of analysis.
Stage 2 to 3: Extracting Significant Statements and Assigning Codes
After reviewing the responses, the next step is to highlight significant statements from each entry. These are short excerpts that contain important details related to the patient’s experience. Breaking the responses into smaller excerpts makes the dataset easier to analyze and organize.
| Response ID | Highlight Excerpt | Assign Code |
| 1 | explained my condition clearly | clear communication |
| 1 | very kind | supportive staff |
| 2 | Waiting time was too long | long waiting time |
| 2 | staff were helpful | supportive staff |
| 3 | felt rushed | rushed consultation |
| 4 | clinic was clean and organized | positive clinic environment |
| 5 | answered all my questions patiently | clear communication |
| 6 | Scheduling an appointment was difficult | scheduling difficulty |
| 7 | listened carefully to my concerns | attentive listening |
| 8 | waited almost two hours | long waiting time |
| 9 | Staff were friendly | supportive staff |
| 9 | communication was confusing | unclear communication |
| 10 | comfortable experience | positive patient experience |
Once the excerpts have been identified, each one is assigned a code based on its meaning. Codes are short descriptive labels used to summarize the main idea of a statement.
Stage 4: Grouping Codes into Categories
After assigning codes, the next step is to group related codes into broader categories. Categories are used to organize codes that describe similar ideas, issues, or observations within the dataset. This helps reduce fragmentation in the analysis and makes the data easier to interpret.
| Unique Code | Category |
| clear communication | communication quality |
| attentive listening | communication quality |
| unclear communication | communication issues |
| long waiting time | operational delays |
| scheduling difficulty | operational delays |
| rushed consultation | consultation experience |
| supportive staff | positive staff interaction |
| positive clinic environment | positive patient experience |
| positive patient experience | positive patient experience |
At this stage, the analysis shifts from examining individual statements to organizing multiple codes into more structured groups. These categories will later serve as the foundation for developing broader themes in the succeeding stage of thematic analysis.
Stage 5: Developing Themes
After organizing the codes into categories, the next step is to identify themes from the grouped categories. Themes represent the main patterns observed throughout the dataset and are used to summarize the key findings of the analysis. Compared to codes and categories, themes focus more on the overall meaning and interpretation of the data.
| Unique Category | Theme |
| communication quality | Communication and Trust |
| communication issues | Communication and Trust |
| operational delays | Operational Challenges |
| consultation experience | Operational Challenges |
| positive staff interaction | Positive Patient Experience |
| positive patient experience | Positive Patient Experience |
At this stage, categories that relate to a similar idea are combined under a single theme. These themes are then used to present the qualitative findings in a clearer and more organized manner.
Stage 6: Interpreting the Findings
The final stage of thematic analysis involves interpreting the themes and connecting them to the objectives of the study. At this point, the themes, categories, and codes are examined together to understand what the data is collectively communicating. The goal is no longer just to organize the responses, but to explain the meaning behind the identified patterns.
| Theme | Categories | Codes | Interpretation |
| Communication and Trust | communication quality, communication issues | clear communication, attentive listening, unclear communication | Patients reported both positive and negative communication experiences. While some appreciated clear explanations and attentive listening, others experienced confusing communication during their visits. |
| Operational Challenges | operational delays, consultation experience | long waiting time, scheduling difficulty, rushed consultation | Some patients experienced long waiting times and scheduling difficulties. These operational issues negatively affected the overall patient experience. |
| Positive Patient Experience | positive staff interaction, positive patient experience | supportive staff, positive clinic environment, positive patient experience | Friendly staff interactions and a clean clinic environment contributed to positive overall experiences among patients. |
In this example, the themes developed through thematic analysis were used to summarize different aspects of the patient experience, including communication, operational concerns, and positive interactions within the clinic environment. These interpretations form the final qualitative findings of the analysis and present the overall insights gathered from the dataset.
As shown in the example, thematic analysis can organize qualitative responses into codes, categories, and themes to produce structured findings. Smaller analyses can often be done manually through spreadsheets or pen-and-paper methods, while larger research projects may require more advanced research workflows and the use of statistical or qualitative analysis software.
Knowing the general process is only the first step. The real challenge comes from handling larger datasets and translating qualitative findings into research conclusions. If your project requires deeper analytical support, our team at Data2Stats Consultancy Inc. offers services such as Statistical Consulting for Research and dedicated Data Analysis to help researchers and organizations move from raw qualitative data to reliable research findings. With that, this concludes our overview of thematic analysis and its general workflow in qualitative research.