Introduction
Comparative effectiveness research (CER) evaluates how different health programs or treatments perform in routine practice, determining which option delivers better real-world health results. Providers often deliver different care to patients with similar conditions, largely due to uncertainty and limited guidance. Studying these practice differences helps assess which prevention and treatment strategies work best, their risks, and their costs. In this article, we’ll walk you through the overview of study design, data collection methods, demonstrate implementation in R, and outline best practices for data analysis and interpretation.
What is Comparative Effectiveness Research ?
(CER)’s primary goal is to determine which treatments or interventions work best for specific patient groups in real-world clinical settings. CER involves conducting systematic reviews of existing evidence as well as collecting and analyzing primary data.
Define Criteria for Participants & Recruitment of Patients
Establishing clear criteria for selecting study participants is essential. It enables researchers to define the study population in a consistent, objective, and reliable way. Setting both inclusion and exclusion criteria also helps protect participants by reducing potential risks. These criteria specify who from the target population is eligible or ineligible to take part in the study.
Intervention Group
Defining the intervention group also called the experiment group is a crucial step. Researchers assign patients to this group based on clinical indications. The intervention group consists of those receiving the treatment under study, which may include medical procedures, medical devices, lifestyle changes (e.g., diet and exercise), educational programs, or counseling.
Outcome Measures
Selecting outcomes for observational CER studies requires considering stakeholder perspectives (e.g. patients, providers, payers, regulators, industry, academia, and the intended use of the results). Outcomes also depend on the study’s scope and funding. The chosen outcomes determine study design elements, including data sources, follow-up timing and duration, and sample size, which is influenced by outcome frequency, effect size, and measurement scale.
D2S provides Statistical Consulting for Research to help shape your study from the outset, aligning it with your objectives and ensuring the results are valid and meaningful for your target audience.
Data Collection
Comparative effectiveness research data usually gather data through:
- Standardized forms – Structured tools used to consistently collect patient and treatment information.
- Published studies – Existing research literature that provides evidence on intervention outcomes.
- Existing data from delivery of care – Administrative claims, medical charts, electronic health records.
- Clinical registries – Organized databases tracking patients with specific conditions or treatments over time.
Information collected by clinical investigators – Data gathered directly by researchers during studies or trials.
Data Analysis
Using statistical methods, researchers examine the collected data to reveal key insights, such as:
- Descriptive statistics to summarize data using measures like mean, median, and percentages.
- T-tests, Welch’s t-tests, or Mann-Whitney U tests to compare continuous outcomes between intervention groups
- Chi-square tests or Fisher’s exact test to compare categorical outcomes or event rates between intervention groups
- Multivariable regression analysis to adjust for confounders to assess intervention-outcome relationships
- Propensity score matching to create comparable intervention groups in observational studies to reduce bias.
With Data2Stats’ Data Analysis service, you can harness advanced statistical models and modern methodologies to generate robust and insightful findings from your data.
Ethical Considerations
This type of studies requires the researchers to abide by ethical compliance. That said researchers must:
- Secure informed consent
- Protect participant’s privacy and confidentiality
- Design study that protects participants from harm
- Ensure participants are not pressured to join the study
- Avoid biases
- Follow international research standards
How to perform a Comparative Effectiveness Research
- Identify decision makers (stakeholders) and their use of the data. The study aims to produce actionable data and clarify who will use it, what it will address, when, and how. Stakeholders may include patients, physicians, payers, and policymakers.
- Synthesize current knowledge. Determine what is known (scientifically certain) and not known (uncertain).
- Focus on the research question. Which questions, if answered, would reduce uncertainty and guide decision-makers.
- Determine a single or a staged project. One research project may suffice, but a staged series of studies can better support decision-making and optimize resource use.
- Determine PICOTS specifics. PICOTS stands for Population, Interventions, Comparisons, Outcomes, Timeframe, and Settings.
- Collect the Data. Sources can be standardized forms, published studies, existing data from delivery of care, clinical registries, information collected by clinical investigators. Ensure standardized tools are used for consistency.
- Organize and Clean the Data. Ensure the data is structured using tools like Excel, R, SPSS, or Python. Be sure to handle missing values and check for outliers.
- Choose the Right Statistical Tests. Choose the analysis method that best fits your objective.
- Interpret Results. Study endpoints should be meaningful for clinical decision-making.
Sample Implementation Using R
This tutorial examines the effects of two blood pressure medications, Drug A and Drug B, on systolic blood pressure reduction over three months using hypothetical data from 200 patients. We will guide you through three key steps: (1) estimating propensity scores and matching intervention groups, (2) conducting multivariable regression to adjust for confounders, and (3) interpreting and visualizing the results.
Step 1. Open RStudio.
Step 2. Load required R packages. You may skip this step if the packages are already loaded into your R library.
# Install if necessary
# install.packages(c("dplyr", "ggplot2", "tableone", "MatchIt"))

library(dplyr)
library(ggplot2)
library(tableone)   # For descriptive stats
library(MatchIt) # For propensity score matchingStep 3. Create a dataset in R.
set.seed(123)
>
> n <- 200  # sample size
>
> data <- data.frame(
    patient_id = 1:n,
    age = rnorm(n, mean = 55, sd = 10),
    sex = sample(c("Male", "Female"), n, replace = TRUE),
    baseline_sbp = rnorm(n, mean = 150, sd = 15),
    comorbidity_score = rpois(n, lambda = 2),
    treatment = sample(c("DrugA", "DrugB"), n, replace = TRUE)
 )
>
> # Simulate SBP outcome after 3 months
> data <- data %>%
    mutate(
        sbp_3m = baseline_sbp -
            ifelse(treatment == "DrugA", rnorm(n, 10, 5), rnorm(n, 7, 5)) -
            0.5*comorbidity_score
    )
>
> head(data)
  patient_id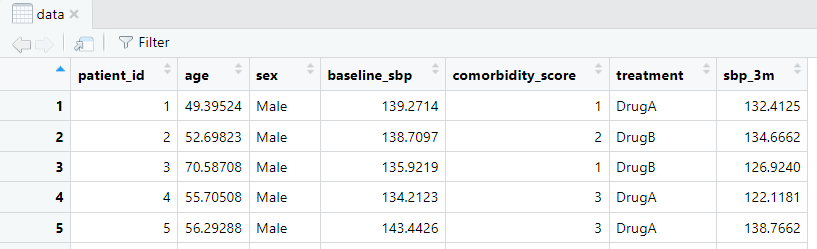
Fig 1. Sample dataset in R.
Step 4. Build the descriptive statistics.
# Create a table comparing baseline characteristics by treatment
vars <- c("age", "sex", "baseline_sbp", "comorbidity_score")
table1 <- CreateTableOne(vars = vars, strata = "treatment", data = data, test = TRUE)
print(table1)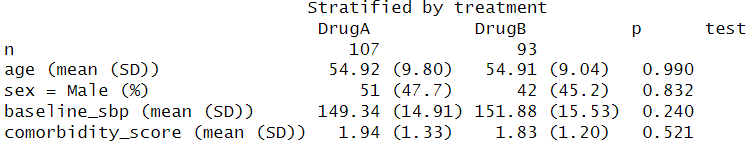
Fig 2. Descriptive statistics of the baseline characteristics by treatment.
Interpretation: All baseline variables show p > 0.05, indicating no significant differences between DrugA and DrugB groups. Well-balanced groups reduce confounding, so any observed differences in outcomes (e.g., 3-month SBP reduction) can be more confidently attributed to the treatment rather than baseline differences.
Step 5. Adjust the confounding with propensity score matching.
# Convert to factor (recommended)
data$treatment <- factor(data$treatment, levels = c("DrugA", "DrugB"))

# Using factor version
ps_model <- glm(treatment ~ age + sex + baseline_sbp + comorbidity_score,
                family = binomial(), data = data)

data$pscore <- predict(ps_model, type = "response")

# Perform matching
match <- matchit(treatment ~ age + sex + baseline_sbp + comorbidity_score,
                 data = data, method = "nearest", ratio = 1)

matched_data <- match.data(match)

# Check balance
summary(match)
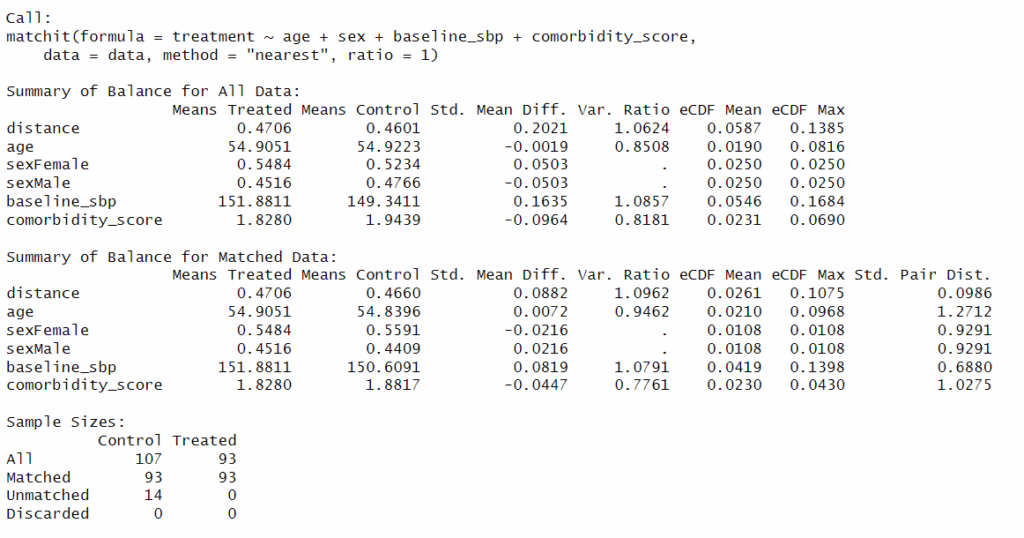
Fig 3. Adjustment of the confounder.
Interpretation: Standardized mean differences (SMDs) for all covariates are now <0.1, which is commonly considered acceptable for good balance. After matching, analysis will use 93 treated vs 93 matched controls. Treated and control groups are now more similar in their probability of receiving treatment.
Step 6. Compare outcomes after matching.
# Compare SBP reduction between DrugA and DrugB
t.test(sbp_3m ~ treatment, data = matched_data)

# Optional: Visualize
ggplot(matched_data, aes(x = treatment, y = sbp_3m, fill = treatment)) +
  geom_boxplot() +
  labs(title = "SBP at 3 Months by Treatment", y = "Systolic BP (mmHg)") +
  theme_minimal()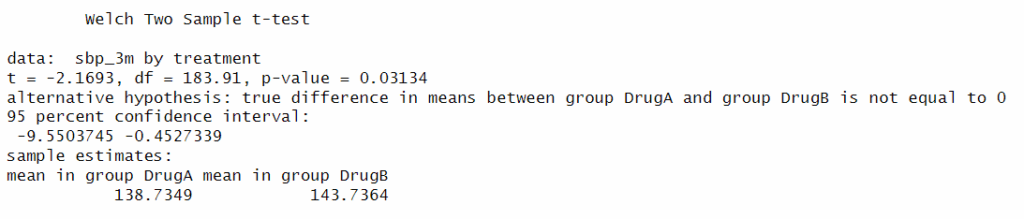
Fig 4. Compare outcomes after matching.
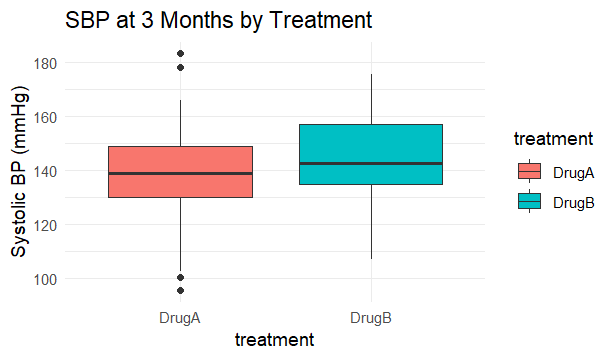
Fig 5. Illustration of comparison of outcomes after matching.
Interpretation: We are 95% confident that Drug A lowers SBP by approximately 0.45 to 9.55 mmHg compared to Drug B. Drug A reduces systolic blood pressure more than Drug B at 3 months.
Step 7. Perform multivariable regression.
# Linear regression adjusting for covariates
reg_model <- lm(sbp_3m ~ treatment + age + sex + baseline_sbp + comorbidity_score, data = matched_data)
summary(reg_model)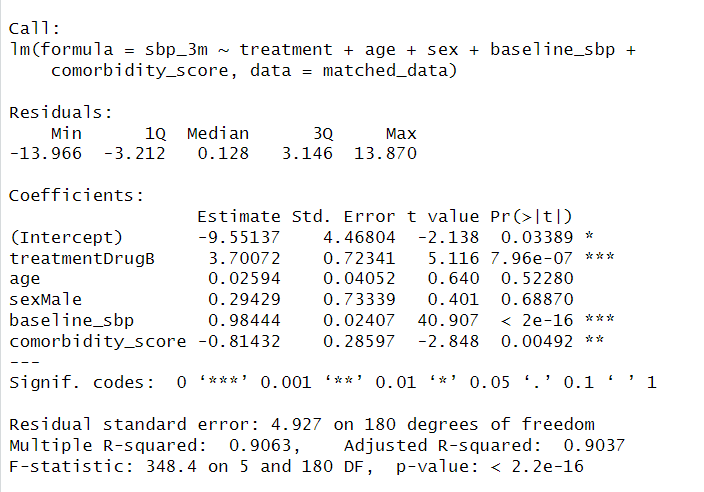
Fig 6. Adjust for remaining covariates in matched data.
Interpretation: Results show that baseline SBP is the strongest predictor, showing an approximately 1:1 relationship, while age and sex are not significant; additionally, higher comorbidity is associated with slightly lower SBP.
Advantages and Limitations
CER offers valuable insights that improve clinical decision-making, optimize resources, and enhance patient outcomes, contributing to more efficient and equitable healthcare. However, it requires careful study design to account for biases and ensure data quality. Policymakers, clinicians, and patients must consider these limitations when interpreting CER findings.
Conclusions
CER is essential for identifying the most effective and cost-efficient treatment options, guiding clinical decisions, and improving patient outcomes. By comparing different interventions in real-world settings, CER ensures that healthcare resources are used efficiently while providing patients with the best possible care.
At Data2Stats Consultancy Inc., we blend expert Statistical Consulting for Research with comprehensive Data Analysis to support you in creating studies that are rigorous, insightful, and meaningful.