
 Sheen Mae Orongan
Marketing teams often focus on growing revenue, improving return on ad spend (ROAS), and scaling advertising campaigns. While these metrics provide valuable insights, they don’t always answer the most important business question:
Is your marketing actually profitable?
This is where the Marketing Efficiency Ratio (MER) becomes an essential metric. MER measures how much revenue is generated for every dollar spent on advertising, making it a useful indicator of overall marketing efficiency. However, a high MER doesn’t necessarily mean a business is making money. Advertising can generate impressive revenue while still failing to cover product costs, fulfillment expenses, operating costs, and other business expenses.
Rather than asking, “What is a good Marketing Efficiency Ratio?”, businesses should ask:
“What is the minimum MER our business needs to remain profitable?”
The answer depends on your company’s unique cost structure, not on a universal industry benchmark.
In this article, we’ll explain what Marketing Efficiency Ratio (MER) is, why it should never be evaluated in isolation, and how businesses can calculate their minimum profitable MER, also known as the break-even MER, using contribution margin. To illustrate the methodology, the examples and figures presented throughout this article are based on a synthetic dataset designed to preserve realistic business relationships while protecting confidential company information.
What Is Marketing Efficiency Ratio (MER)?
The Marketing Efficiency Ratio (MER) measures how efficiently advertising spend generates revenue. Unlike channel-specific metrics, MER evaluates the performance of marketing as a whole by comparing total revenue against total advertising spend.
The formula is straightforward:
MER = Revenue ÷ Advertising Spend
For example, if a business spends $10,000 on advertising and generates $50,000 in revenue, its MER would be:
MER = 50,000 ÷ 10,000 = 5.0
An MER of 5.0 means that every dollar invested in advertising generated five dollars in revenue.
Because it is simple to calculate and easy to understand, MER is widely used as a high-level indicator of advertising efficiency. In general:
- A higher MER means advertising generates more revenue for every dollar spent.
- A lower MER means advertising consumes a larger portion of generated revenue.
However, while MER provides a useful overview of marketing performance, it tells only part of the story. Revenue alone does not determine whether a campaign is financially successful.
Why MER Alone Can Be Misleading
One of the most common misconceptions in marketing analytics is that a higher MER automatically means higher profitability.
In reality, MER considers only revenue and advertising spend. It does not account for the many costs involved in delivering products or services to customers.
For example, MER ignores costs such as:
- Cost of goods sold (COGS)
- Fulfillment expenses
- Shipping costs
- Payment processing fees
- Discounts
- Refunds
- Operating expenses
These costs directly affect how much revenue remains after each sale. Two businesses may achieve the exact same MER but experience very different financial outcomes because their cost structures differ.
Imagine two companies that both report an MER of 5.0.
Company A sells digital products with minimal fulfillment costs and high margins. Company B sells physical products that require manufacturing, warehousing, shipping, and frequent promotional discounts. Although both companies generate the same amount of revenue relative to advertising spend, Company A is likely to retain significantly more profit.
This illustrates why there is no universal marketing efficiency ratio benchmark that applies to every business. A “good” MER depends on how much of each revenue dollar remains available after covering variable costs.
Instead of treating MER as a standalone performance metric, businesses should evaluate it together with financial metrics such as contribution margin and overall profitability.
The Relationship Between MER and Profit
The ultimate goal of marketing is not simply to generate revenue, it is to generate profitable revenue.
After deducting variable costs such as product costs, fulfillment, shipping, payment fees, discounts, and refunds, the remaining amount is known as the contribution margin. This represents the portion of revenue available to cover advertising costs and ultimately contribute to profit.
This relationship explains why MER and profitability are closely connected.
When MER increases while contribution margins remain relatively stable, each advertising dollar produces more revenue, allowing a greater portion of sales to contribute toward profit.
Conversely, when MER declines, advertising consumes a larger share of revenue. If MER falls below a certain threshold, the contribution generated after variable costs is no longer sufficient to recover advertising expenses. At that point, marketing may still generate sales, but it begins reducing rather than creating economic value.
The following scatter plot illustrates this relationship using the synthetic dataset. Each point represents one week of observations, while the fitted trend line highlights the positive association between Marketing Efficiency Ratio and Profit Contribution Percentage.
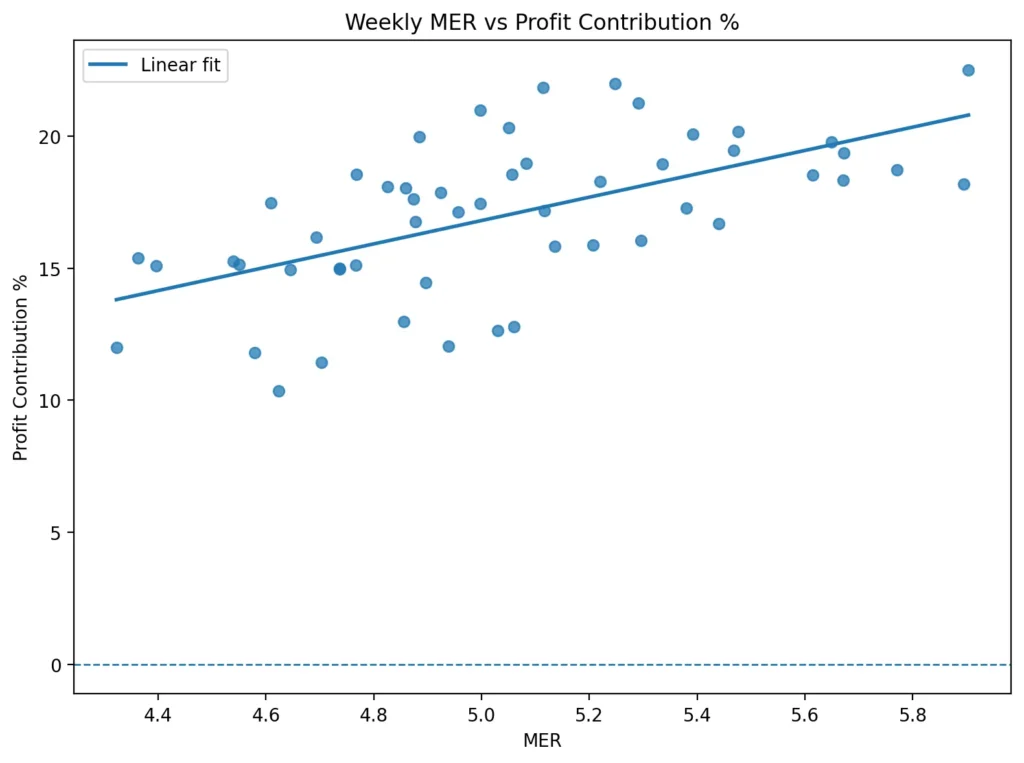
Figure 1. Figure generated using code in Google Colab.
To better illustrate this concept, a synthetic business dataset was generated that models realistic relationships between advertising spend, revenue, and operating costs. The simulated analysis produced:
- Average Historical MER: 5.05
- Average Contribution Margin Before Advertising: 36.94%
- Estimated Break-Even MER: 2.72
These values suggest that advertising remained comfortably above the minimum profitability threshold throughout most simulated periods. In other words, the modeled business generated enough contribution after variable costs to recover advertising expenses while maintaining positive economic value.
To better understand how marketing efficiency is distributed across the simulated business, the chart below shows the weekly MER values generated from the synthetic dataset. Most observations are clustered around the average MER of 5.05, indicating relatively consistent marketing efficiency throughout the simulated period.
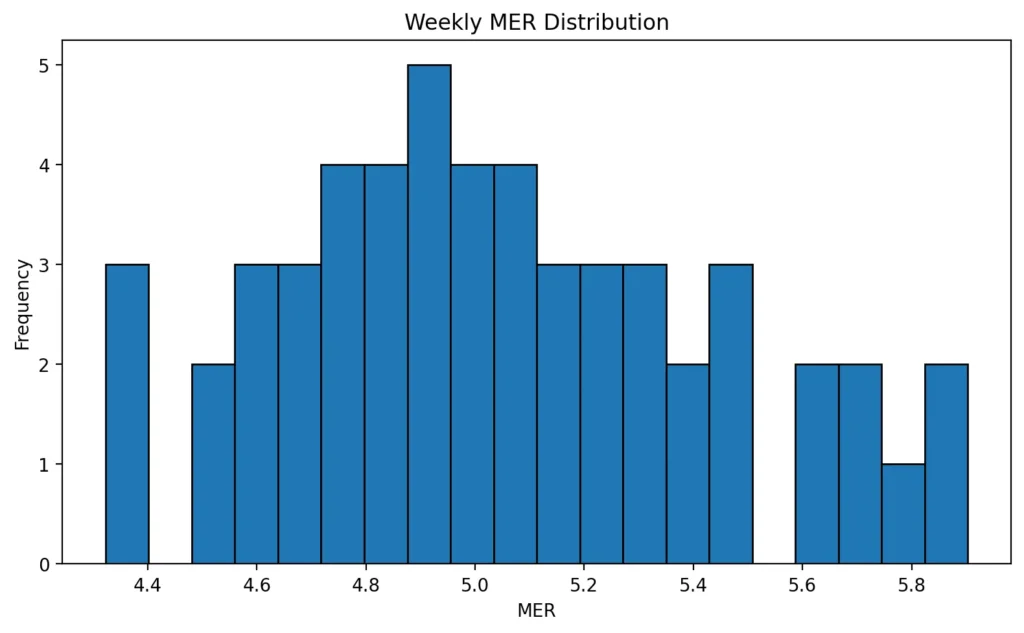
Figure 2. Figure generated using code in Google Colab.
Understanding this relationship is the foundation for determining a profitable Marketing Efficiency Ratio, one that reflects the financial realities of your own business rather than relying on generic industry benchmarks.
What Is the Minimum Economically Viable MER?
Knowing your Marketing Efficiency Ratio is only the first step. The more important question is:
What is the minimum MER my business needs to avoid losing money on advertising?
This threshold is known as the minimum economically viable MER, or break-even MER. It represents the lowest Marketing Efficiency Ratio at which advertising generates enough contribution to recover its own cost after accounting for variable business expenses.
When actual MER falls below this threshold, advertising costs exceed the contribution generated from sales. Although revenue may continue to increase, the business is effectively spending more on customer acquisition than it earns back after covering product-related costs.
Conversely, when actual MER remains above the break-even point, advertising contributes positively toward business profitability.
Unlike generic marketing benchmarks, the minimum profitable MER is unique to every business because it depends on cost structure, pricing strategy, and operating model.
How Contribution Margin Determines Break-Even MER
To understand why every business has a different break-even MER, it’s important to first understand contribution margin.
Contribution margin represents the amount of revenue remaining after deducting all variable costs associated with fulfilling a sale. These typically include:
- Cost of Goods Sold (COGS)
- Fulfillment costs
- Shipping expenses
- Payment processing fees
- Discounts
- Refunds
The remaining contribution is then available to cover advertising costs, operating expenses, and profit.
For example, imagine a company generates $100 in revenue.
If variable costs total $63, then:
- Revenue = $100
- Variable Costs = $63
- Contribution Margin = $37
In this example, only 37% of revenue remains available to pay for advertising and contribute toward profit.
This percentage, known as the Contribution Margin Percentage, is one of the most important financial metrics for evaluating advertising profitability. Businesses with higher contribution margins retain more revenue from each sale, allowing them to remain profitable even with lower MER values.
Businesses operating with thinner margins, however, require significantly stronger marketing efficiency simply to recover advertising costs.
This relationship explains why comparing MER across companies without considering contribution margin can produce misleading conclusions.
Formula for Calculating Break-Even MER
The break-even MER can be calculated using a surprisingly simple formula:
Break-Even MER = 1 ÷ Contribution Margin Percentage
This equation identifies the minimum Marketing Efficiency Ratio required for advertising to recover its own cost after variable expenses have been deducted.
Example Calculation
Suppose a business has a contribution margin of 40%, or 0.40 when expressed as a decimal.
Using the formula:
Break-Even MER = 1 ÷ 0.40 = 2.50
This means the business must generate at least $2.50 in revenue for every $1 spent on advertising before its advertising begins creating positive economic value.
If actual MER falls below 2.50, advertising costs consume more contribution than they generate. If MER exceeds 2.50, advertising contributes positively toward profitability.
Although the formula itself is simple, it provides far greater insight than relying on arbitrary industry benchmarks because it reflects the economics of the individual business.
Applying the Formula Using the Synthetic Dataset
To demonstrate this methodology, we applied the calculations to a synthetic dataset designed to simulate realistic revenue, advertising spend, and cost relationships while protecting confidential business information.
The analysis produced the following key metrics:
| Metric | Synthetic Result |
| Average Contribution Margin Before Advertising | 36.94% |
| Average Historical MER | 5.05 |
| Estimated Break-Even MER | 2.72 |
The simulated contribution margin of 36.94% indicates that approximately one-third of every revenue dollar remains after covering variable costs. Applying the break-even formula results in a minimum profitable MER of approximately 2.72.
Since the simulated historical MER averaged 5.05, marketing performance remained comfortably above the profitability threshold.
This indicates that, within the synthetic business scenario, advertising generated sufficient contribution not only to recover advertising costs but also to support continued business profitability.
Rather than evaluating a single average value, businesses should also monitor how MER changes over time using interactive dashboard reporting. The trend below shows weekly MER values together with a four-week rolling average, making it easier to identify longer-term performance patterns while smoothing short-term fluctuations.
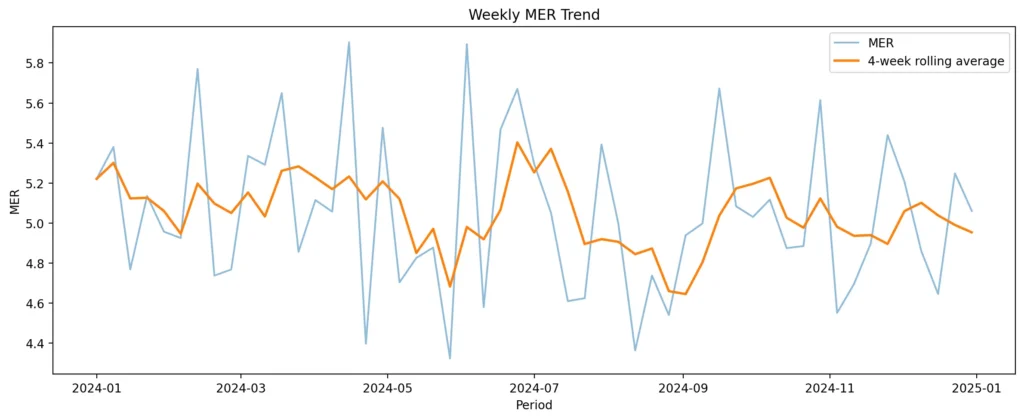
Figure 3. Figure generated using code in Google Colab.
Monitoring MER trends over time helps businesses identify periods where marketing efficiency improves or begins to decline. Instead of reacting to isolated weekly fluctuations, decision-makers can focus on longer-term patterns that may indicate opportunities for optimization or signal emerging performance issues.
Rather than focusing solely on whether MER increases or decreases over time, businesses should monitor MER through interactive dashboards that visualize advertising performance and track whether it remains safely above the break-even threshold. This provides a much clearer indication of advertising profitability than evaluating revenue growth alone.
As costs, pricing strategies, and product mixes evolve, contribution margins also change. Consequently, the minimum profitable MER should be recalculated periodically to ensure that marketing decisions continue to align with the business’s current financial structure.
Healthy vs. Risky MER Ranges
One of the most frequently asked questions by marketers is:
“What is a good Marketing Efficiency Ratio?”
The answer is that there is no universal marketing efficiency ratio benchmark. A healthy MER for one business may be unsustainable for another because every organization has different margins, operating costs, pricing strategies, and business models.
Rather than relying on fixed industry benchmarks, businesses should compare their actual MER against their calculated break-even MER.
The following classifications provide a practical framework for interpreting MER performance:
| MER Performance | Interpretation |
| Below Break-Even MER | Advertising is unlikely to recover its own costs and may reduce profitability. |
| Near Break-Even MER | Campaigns recover advertising costs but leave little margin for growth or unexpected cost increases. |
| Above Break-Even MER | Marketing generates positive contributions after advertising costs and supports sustainable growth. |
| Well Above Break-Even MER | Advertising performs efficiently and provides greater flexibility for scaling marketing investments. |
In the synthetic analysis presented earlier, the average historical MER of 5.05 exceeded the estimated break-even MER of 2.72 by a comfortable margin. This positive gap indicates that advertising remained economically viable throughout the simulated period.
Instead of relying solely on numerical thresholds, it is also useful to examine how profitability changes across different MER ranges. The synthetic analysis grouped weekly observations into business-readable MER ranges and compared their corresponding median profit contribution.
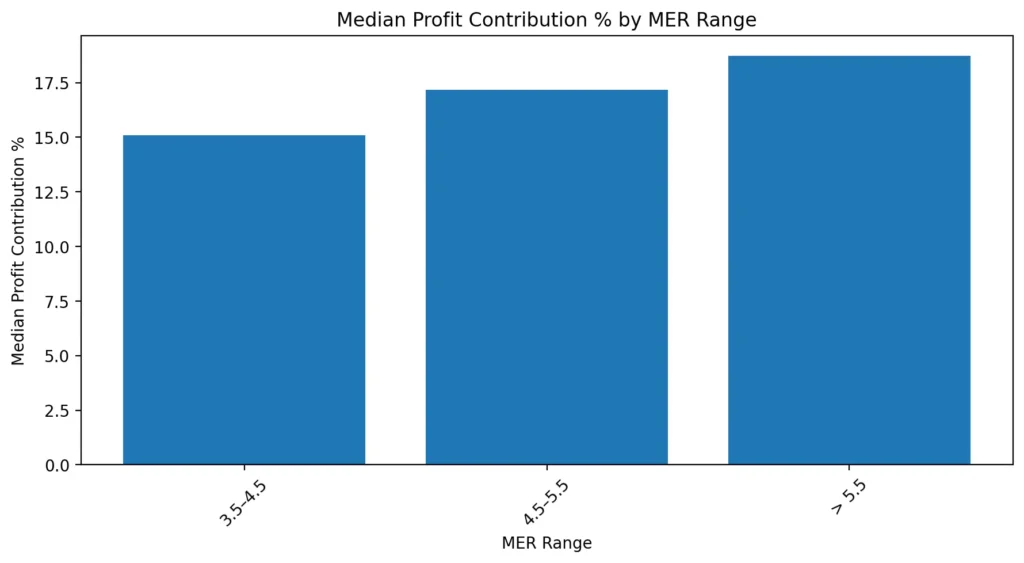
Figure 4. Figure generated using code in Google Colab.
The chart shows that higher MER ranges generally correspond to stronger median profit contribution. While every business has its own profitability threshold, this reinforces the principle that improving marketing efficiency can create greater financial value when supported by healthy contribution margins.
Why Every Business Has a Different Ideal MER
Many online articles suggest that businesses should target a specific MER value, such as 4.0 or 5.0. While these benchmarks may provide general context, they should never replace business-specific analysis.
Several factors influence what constitutes a profitable MER, including:
- Product margins
- Pricing strategy
- Customer acquisition costs
- Shipping and fulfillment expenses
- Promotional discounts
- Operating expenses
- Industry characteristics
For example, a software-as-a-service (SaaS) company typically has relatively low fulfillment costs and high contribution margins. Because a larger portion of each sale remains after variable expenses, the business can remain profitable even at a lower MER.
Conversely, an e-commerce retailer selling physical products may incur substantial costs for inventory, shipping, packaging, and returns. These additional expenses reduce contribution margin, increasing the minimum MER required to maintain profitability.
This is why businesses should calculate their own break-even MER instead of relying solely on external benchmarks. A profitable marketing efficiency ratio should always reflect the financial realities of the organization rather than an industry average.
Using MER for Budget Planning
MER is more than a reporting metric, it can also support better budgeting and strategic decision-making.
When evaluated alongside contribution margin, MER helps businesses answer important questions such as:
- Can advertising budgets be increased without reducing profitability?
- Is current marketing performance sufficient to justify scaling campaigns?
- How much efficiency can decline before advertising becomes unprofitable?
- Which periods require optimization before increasing spend?
Instead of using revenue growth alone to evaluate marketing performance, decision-makers can compare actual MER with their break-even threshold to determine whether campaigns continue to generate positive economic value.
For example, suppose a business consistently achieves an MER of 5.0 while its break-even MER is 2.7. This difference provides a financial buffer, allowing marketing teams to test new campaigns, expand into additional channels, or increase advertising budgets while remaining above the profitability threshold.
However, if actual MER begins approaching the break-even point, businesses may need to optimize campaign performance, improve contribution margins, reduce advertising costs, or reassess pricing strategies before scaling further.
Using MER in this way transforms it from a descriptive performance indicator into a practical planning tool that supports more informed marketing investment decisions.
Common Mistakes Businesses Make When Using MER
Although MER is a valuable metric, it is often misunderstood or applied incorrectly. The following are some of the most common mistakes businesses make when evaluating marketing performance.
1. Assuming a High MER Always Means High Profit
Generating more revenue does not automatically translate into higher profitability. Without considering costs, even campaigns with strong MER values can fail to create meaningful financial returns.
2. Ignoring Contribution Margin
Contribution margin determines how much revenue remains available after covering variable costs. Without this context, MER alone provides only a partial view of marketing performance.
3. Using Universal Industry Benchmarks
A marketing efficiency ratio benchmark that works for one business may be completely inappropriate for another. Businesses should calculate thresholds based on their own financial structure rather than relying on generalized recommendations.
4. Evaluating Revenue Instead of Economic Value
Revenue growth is important, but sustainable growth depends on profitability. Businesses should measure whether advertising contributes positively after accounting for all relevant costs.
5. Failing to Recalculate MER Thresholds
Cost structures change over time. Rising supplier costs, increased shipping expenses, changes in pricing, or evolving advertising costs all affect contribution margins. As these factors change, businesses should periodically update their break-even MER calculations to ensure their benchmarks remain relevant.
Final Takeaways
Marketing Efficiency Ratio is one of the simplest metrics to calculate, yet one of the easiest to misinterpret.
While MER provides a valuable measure of advertising efficiency, it should never be evaluated in isolation. Revenue alone does not determine whether marketing investments create sustainable business value.
By combining MER with contribution margin, businesses can calculate their minimum profitable MER, the break-even point at which advertising begins contributing positively after covering variable costs. This provides a far more meaningful benchmark than relying on generic industry averages.
Throughout this article, we demonstrated the methodology using a synthetic dataset designed to preserve realistic relationships between revenue, advertising spend, and business costs while protecting confidential company information. The analysis illustrated how contribution margin influences the break-even MER and why each business should establish its own profitability threshold.
Ultimately, the question is not simply whether your MER is “good.” The more important question is whether your MER is high enough to support sustainable, profitable growth given your organization’s unique cost structure.
By regularly monitoring contribution margin, recalculating break-even MER, and comparing actual marketing performance against economically meaningful thresholds, businesses can make more informed data-driven decisions about advertising budgets, campaign optimization, and long-term growth.
Note: All figures and numerical examples presented in this article are based on a synthetic dataset created for educational and demonstration purposes.