Introduction
A laboratory experimental study plays a crucial role in uncovering the biological mechanisms and pathophysiological pathways underlying diseases.
Unlike observational studies that examine associations in populations, laboratory experiments use controlled conditions to test hypotheses directly.
In this blog, we’ll explore how to design, conduct, and analyze a laboratory experimental study – and use Python to transform raw laboratory data into meaningful insights.
What Is a Laboratory Experimental Study?
A laboratory experimental study is a research approach designed to investigate mechanisms, behaviors, or processes by examining samples or data collected under controlled conditions.
These studies generate data by manipulating variables and observing their effects on the system of interest – whether biological, chemical, physical, behavioral, or technical – allowing researchers to uncover cause-and-effect relationships in a controlled environment.
Participants and Sampling
The process begins with identifying and obtaining the samples or subjects required for the experiment.
Depending on the research focus, participants or samples may include:
- Biological samples: blood, tissue, cells, or microbial cultures
- Human participants: volunteers in behavioral, cognitive, or physiological studies
- Animal models: lab animals or cultured cells
- Technical or engineered systems: machines, materials, or synthetic tissues
To ensure reliability and ethical integrity, researchers must:
- Obtain informed consent from all human participants
- Ensure ethical approval from an institutional review board (if applicable)
- Maintain confidentiality and proper handling of all data or materials
Data2Stats provides Statistical Consulting to help your study’s design and sampling meet the highest scientific and ethical standards.
Experimental Procedures and Data Collection Methods
Experiments are conducted in a controlled laboratory or simulated setting, where variables can be precisely manipulated and measured.
Depending on the study type, measurements may include:
- Biological or chemical variables (e.g., gene expression, enzyme activity, reaction rate)
- Behavioral or psychological responses (e.g., attention span, decision accuracy)
- Technical or performance metrics (e.g., machine efficiency, material strength)
All procedures follow standardized methods to ensure accuracy, replicability, and validity of results.
Data Analysis
Once data is collected, the next step is to apply appropriate statistical analyses to test hypotheses and interpret findings.
Possible methods include:
- Descriptive statistics: summarize data per group
- T-tests or ANOVA: compare means across experimental conditions
- Correlation analysis: identify relationships between variables
- Regression models: determine predictors of outcomes
- Path or mediation analysis: explore underlying mechanisms or causal links
Data2Stats’ Data Analysis service leverages advanced statistical models and contemporary techniques to reveal insights that go beyond simple comparisons.
Ethical Considerations
Laboratory experimental research requires strict ethical compliance:
- Informed consent from participants
- Confidentiality of biological data
- Responsible sample handling and disposal
These ensure scientific integrity and respect for research participants.
How to Perform a Laboratory Experimental Research
- Define the Objective: Clearly state the mechanism, process, or system you aim to investigate.
- Formulate a Hypothesis: Develop a testable statement predicting expected relationships or effects.
- Select Samples: Identify and classify the appropriate samples or subjects for your study.
- Design the Experiment: Choose suitable laboratory or controlled techniques and standardize all procedures.
- Collect Data: Measure relevant variables under controlled conditions.
- Ensure Ethics: Follow ethical guidelines, including informed consent and proper handling of samples or data.
- Analyze Data: Apply statistical tools such as t-tests, ANOVA, correlation, or regression to test hypotheses.
- Interpret Results: Relate findings to the underlying mechanisms or processes under study.
- Validate Findings: Repeat experiments or cross-check results to ensure reliability and reproducibility.
- Report Outcomes: Present methods, data, and conclusions transparently for peer review or dissemination.
Sample Implementation Using Python
In this tutorial, we’ll simulate a laboratory experimental study aimed at understanding biological differences between healthy and diseased tissue samples. Using a hypothetical dataset of 50 samples, we’ll walk through:
- Descriptive statistics of key biomarkers,
- Hypothesis testing,
- Correlation analysis, and
- Basic regression modeling.
Objective: To determine whether gene expression, protein concentrations, and inflammation markers differ between healthy and diseased individuals, and to identify which factors predict disease severity.
Our dataset includes measurements for:
- Gene Expression (GE)
- Protein Concentration (PC)
- Enzyme Activity (EA)
- Oxidative Stress Marker (OSM)
Each sample is classified as Healthy or Diseased, with associated lab results recorded.
Step 1. Open Python or Google Colab
Step 2 : Import the Data at Libraries
Import the Data
We are uploading the data manually
from google.colab import files
uploaded = files.upload()  # Choose your CSV file when prompted


import io
import pandas as pd
file_path = list(uploaded.keys())[0]
Fig 2. Uploading Sample Dataset
Import the Libraries:
import pandas as pd
import numpy as np
import matplotlib.pyplot as plt
import seaborn as sns
from scipy import stats
import statsmodels.api as sm
import statsmodels.formula.api as smf


# Load the dataset
df = pd.read_csv("lab_sample_data.csv")


# View the first few rows
df.head()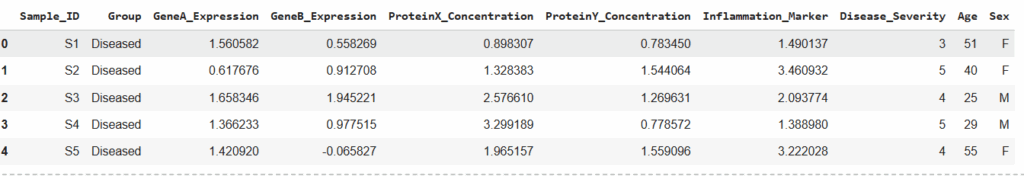
Fig 3. Sample Dataset is Loaded in Python
Step 3. Descriptive Statistics
# Group frequency distribution
group_counts = df['Group'].value_counts()
group_percent = (df['Group'].value_counts(normalize=True) * 100).round(2)


# Combine counts and percentages
group_summary = pd.DataFrame({'Count': group_counts, 'Percentage': group_percent})
print(group_summary)


# Visualization
import matplotlib.pyplot as plt
group_summary['Count'].plot(kind='bar', color=['skyblue', 'salmon'])
plt.title('Distribution of Participants by Group')
plt.ylabel('Count')
plt.xlabel('Group')
plt.show()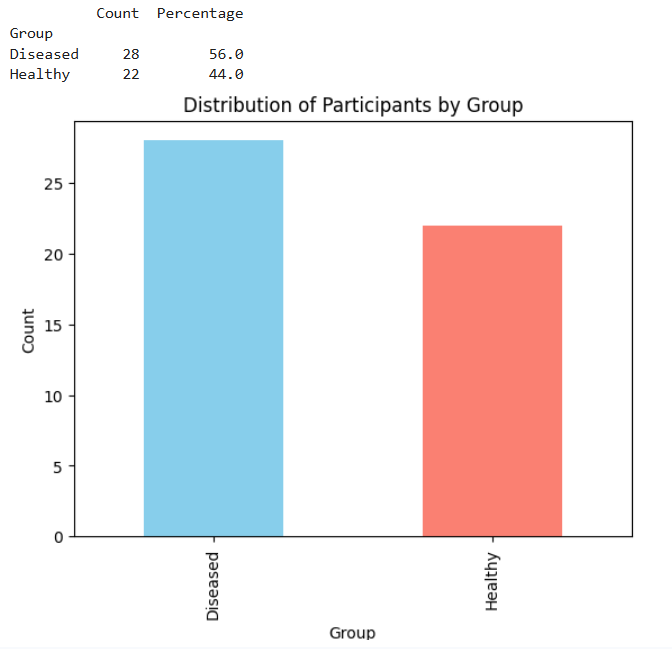
Fig 4. Participant Group Composition
Interpretation: Out of the 50 participants, 28 (56%) are in the Diseased group and 22 (44%) are in the Healthy group. This suggests that the dataset is fairly balanced, allowing reliable comparison between the two conditions.
Statistical Comparison of Biological Variables
variables = ['GeneA_Expression', 'GeneB_Expression',
             'ProteinX_Concentration', 'ProteinY_Concentration',
             'Inflammation_Marker']


for var in variables:
    healthy = df[df['Group'] == 'Healthy'][var]
    diseased = df[df['Group'] == 'Diseased'][var]
    t_stat, p_val = stats.ttest_ind(healthy, diseased)
    print(f"{var}: t={t_stat:.3f}, p={p_val:.4f}")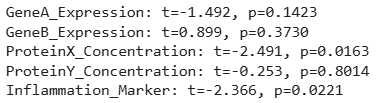
Fig 5. Comparison of Gene and Protein Levels Between Healthy and Diseased Groups
Interpretation:
- GeneA_Expression (p = 0.1423), GeneB_Expression (p = 0.3730), and ProteinY_Concentration (p = 0.8014) showed no significant difference between groups.
- ProteinX_Concentration (p = 0.0163) and Inflammation_Marker (p = 0.0221) showed statistically significant differences, indicating these biomarkers vary meaningfully between healthy and diseased subjects.
These results suggest that ProteinX and Inflammation Marker may be biologically associated with disease status, while GeneA, GeneB, and ProteinY do not differ significantly between healthy and diseased groups under the conditions tested.
Step 4. Visualize Correlations Between Biomarkers
biomarkers = df[['GeneA_Expression', 'GeneB_Expression',
                 'ProteinX_Concentration', 'ProteinY_Concentration',
                 'Inflammation_Marker']]
plt.figure(figsize=(8,6))
sns.heatmap(biomarkers.corr(), annot=True, cmap='coolwarm')
plt.title("Correlation Matrix of Biomarkers")
plt.show()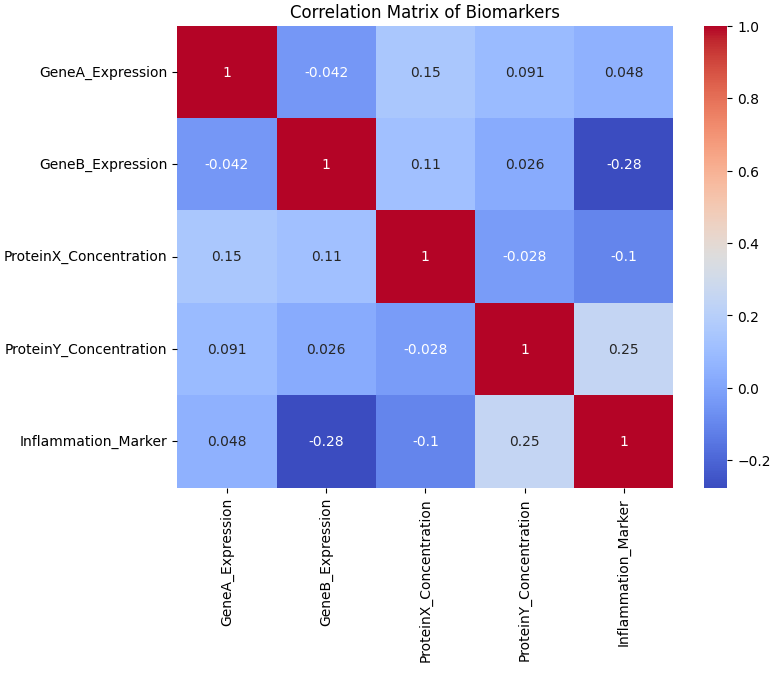
Fig 6. Correlation Matrix Heatmap of Biomarkers
Interpretation:
- The correlation matrix shows the degree of linear relationship between each pair of biomarkers. Correlation values range from -1 (perfect negative) to +1 (perfect positive), with values close to 0 indicating little or no linear relationship.
- Overall trend: Most correlations among biomarkers are weak, suggesting that each biomarker largely varies independently.
- Strongest relationships:
- ProteinY_Concentration and Inflammation_Marker (r = 0.25) show a weak positive correlation, implying that as ProteinY levels slightly increase, Inflammation Marker levels also tend to rise.
- GeneB_Expression and Inflammation_Marker (r = -0.28) show a weak negative correlation, indicating that higher GeneB expression might be slightly associated with lower inflammation marker levels.
- Other pairs (e.g., GeneA–ProteinX, ProteinX–ProteinY) show correlations near zero, suggesting minimal or no association between their levels.
The weak correlations imply that each biomarker may represent distinct biological processes rather than being strongly interdependent. However, the slight associations between ProteinY and Inflammation Marker, and between GeneB and Inflammation Marker, may warrant further investigation in larger samples or more targeted analyses (e.g., regression or pathway modeling).
Step 5. Model Predictors of Disease Severity
model = smf.ols("Disease_Severity ~ GeneA_Expression + GeneB_Expression + \
                 ProteinX_Concentration + ProteinY_Concentration + \
                 Inflammation_Marker + Age + Sex", data=df).fit()
print(model.summary())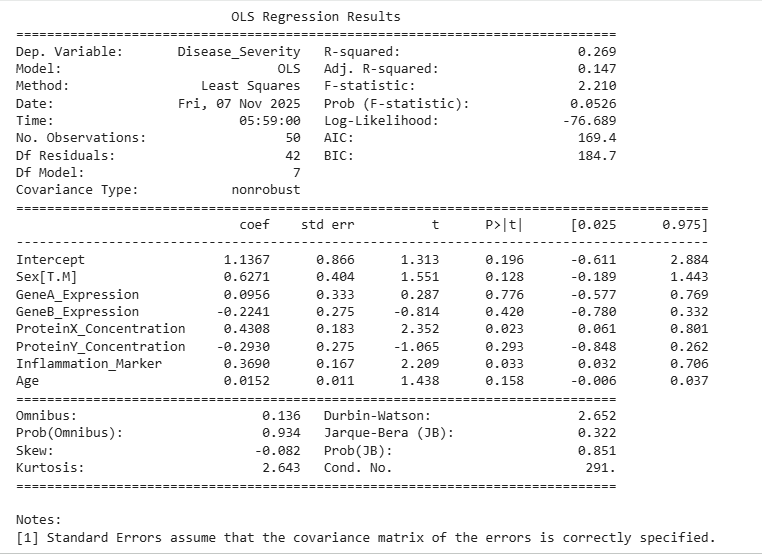
Fig 7. Multiple linear regression predicting Disease Severity from biomarker levels
Interpretation:
- The multiple linear regression model explains approximately 26.9% of the variance in Disease Severity (R² = 0.269), with a near-significant overall model fit (p = 0.0526).
Among the predictors:
- ProteinX_Concentration (β = 0.431, p = 0.023) and Inflammation_Marker (β = 0.369, p = 0.033) emerged as significant positive predictors of disease severity.
This means that higher ProteinX and Inflammation Marker levels are associated with greater disease severity, even after controlling for other factors.
- GeneA_Expression, GeneB_Expression, ProteinY_Concentration, Age, and Sex did not show statistically significant relationships with disease severity (p > 0.05).
Step 6. Visualize Key Findings
sns.boxplot(x='Group', y='Inflammation_Marker', data=df)
plt.title("Inflammation Marker Levels by Group")
plt.show()


sns.scatterplot(x='ProteinY_Concentration', y='Disease_Severity', hue='Group', data=df)
plt.title("ProteinY vs Disease Severity")
plt.show()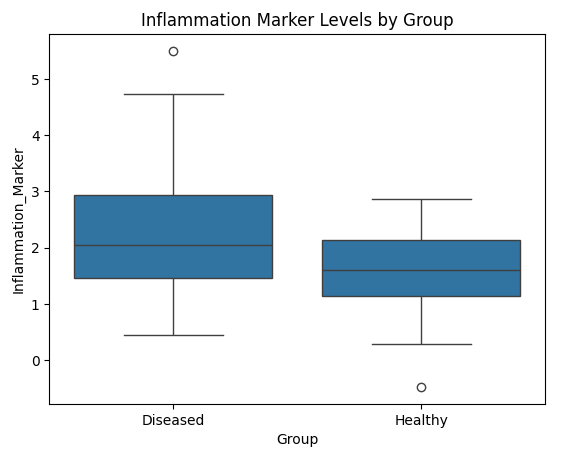
Fig 8. Boxplot of Inflammation Marker Levels by Group
Interpretation:
- The Diseased group shows a higher median and wider range of Inflammation Marker levels compared to the Healthy group, suggesting elevated inflammatory response in diseased subjects. This visual pattern supports the t-test and regression findings, where the Inflammation Marker was identified as a significant predictor of disease status and severity.
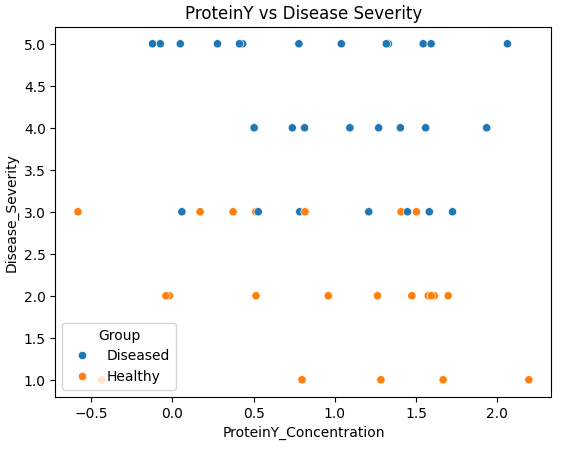
Fig 9. Scatterplot of ProteinY Concentration vs Disease Severity
Interpretation:
- No clear linear trend is evident between ProteinY concentration and Disease Severity across either group. Both healthy and diseased individuals exhibit overlapping distributions, consistent with the regression results showing ProteinY_Concentration was not a significant predictor of disease severity (p = 0.293).
Advantages and Limitations
Advantages of Laboratory Experimental Research:
- Enables controlled testing of biological mechanisms
- Provides measurable, reproducible evidence
- Supports translational insights from lab to clinic
Limitations:
- Often small sample sizes
- May not fully represent real-world conditions
- Can be time- and resource-intensive
Conclusion
Laboratory experimental studies provide the foundation for understanding disease mechanisms and developing targeted treatments.
Through careful design, ethical practices, and robust data analysis – including Python-based statistical modeling – researchers can uncover insights hidden within biological data.
At Data2Stats Consultancy Inc., we ensure that Statistical Consulting, and Data Analysis to ensure every laboratory study is scientifically sound, reproducible, and impactful.