 Annie
Annie 
What is a meta-analysis?
Meta-analysis in R is a powerful approach for computing the combined
effect size of quantitative data from multiple independent studies using
R’s open-source statistical environment
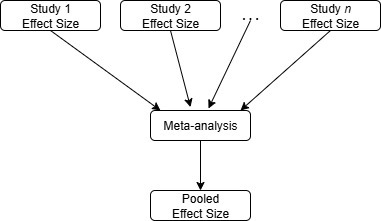
By pooling data, the statistical power is increased leading to more reliable
estimates and can minimize uncertainties found in individual studies.
Meta-analysis in epidemiology
Meta-analysis is widely used in health research to systematically collect
results from pre-existing studies about a particular medical topic to derive
outcomes which may include a more precise measure of the effect of treatment
or risk factor for disease, or other outcomes, compared to any single study
that contributes to the combined analysis.

Concepts
- Effect size: Standardized metric that assesses the strength
of the connection between two or more variables. - Confidence Interval (CI): A range that suggests where the
true population effect is expected to be, reflecting the accuracy of the
calculated effect size. - Heterogeneity: The level of variation or lack of uniformity
in the outcomes of studies that are being combined.
Steps in Meta-Analysis
Step 1: Define research objectives and inclusion criteria
Clearly state the research objectives and establish specific criteria for
including studies in the meta-analysis.
Step 2: Recruitment of Existing Studies
Conduct a thorough search of relevant databases, journals, and other sources
to identify all potentially eligible studies.
Step 3: Study Screening and Data Gathering
Thoroughly screen studies based on the inclusion criteria and gather essential
data, such as effect sizes, sample sizes, and other relevant details.
Step 4: Statistical Analysis
In meta-analysis in R, this step applies the rma() function from the meta for package
to combine data and calculate pooled effect size, confidence intervals, and heterogeneity statistics.
Step 5: Assessment of Heterogeneity
Examine the variability in results across studies to determine if there is
evidence of heterogeneity.
Step 6: Interpretation and Reporting
Interpret the results of the meta-analysis, considering potential limitations
and implications for future research.
R Tutorial
R’s open-source
Performing meta-analysis in R is straightforward — R’s open-source
environment handles everything from effect size calculation to forest plot
visualization within a few lines of code. In this tutorial, we’ll focus on using
a random-effects model to account for variability between studies. To demonstrate
the process, we’ll use a sample dataset (Table 1) based on hypothetical results
from five published studies comparing a treatment group to a control group.
Table 1. Sample Dataset
| Study | Effect Size (log OR) | Standard Error (SE) |
| Study 1 | 0.30 | 0.10 |
| Study 2 | 0.45 | 0.15 |
| Study 3 | 0.20 | 0.12 |
| Study 4 | 0.60 | 0.20 |
| Study 5 | 0.25 | 0.08 |
Step 1: Install and load package ‘metafor’.
install.packages("metafor")
library(metafor)Step 2: Create a dataframe.
data <- data.frame(
    study = paste("Study", 1:5),
    yi = c(0.30, 0.45, 0.20, 0.60, 0.25), # effect sizes (log OR)
    sei = c(0.10, 0.15, 0.12, 0.20, 0.08) # standard errors
)Step 3: Run the meta-analysis: we’ll use the rma() function
from the ‘metafor’ package to compute the pooled effect using a random-effects
model.
res <- rma(yi = yi, sei = sei, data = data, method = "REML")
summary(res)>The output will show:
- Pooled effect size (with CI)
- Test for overall effect
- Measures of heterogeneity: τ² (tau-squared), I², and Q-test
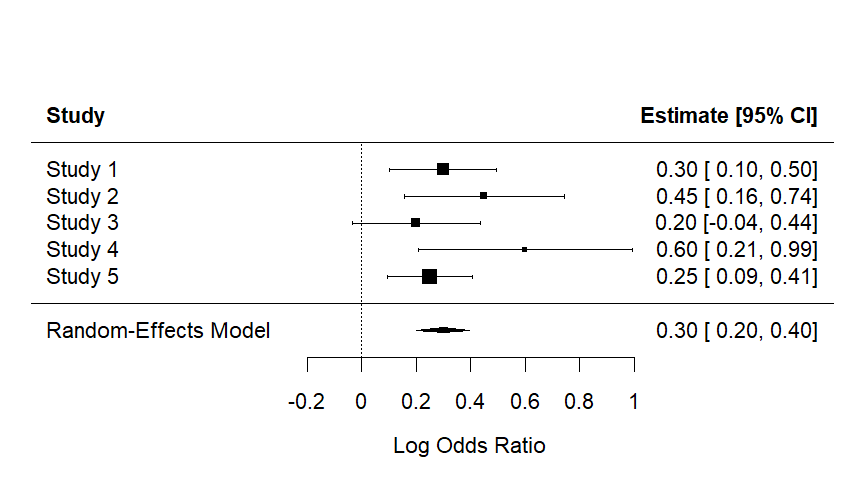
Step 4: Create a forest plot to visualize the individual and
pooled effects.
forest(res, slab = data$study, xlab = "Log Odds Ratio", cex =
0.9)Output:
Step 5: (Optional) Check for publication bias.
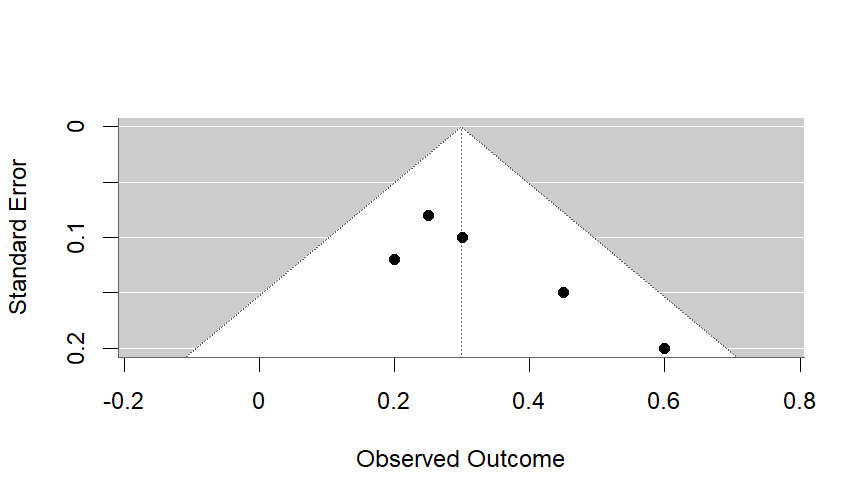
a. Generate a funnel plot to check for asymmetry.
funnel(res)Output:
b. Perform Egger’s Test for small-study effects.
regtest(res, model = "rma")c. Perform trim-and-fill analysis to estimate how the pooled effect changes
after accounting for potential missing studies.
trimfill(res)Meta-analysis in R is a powerful tool for synthesizing evidence across studies,
especially when applied correctly using the meta for package and robust data pooling techniques.
Whether you’re conducting
systematic reviews or clinical trials, mastering these methods can significantly enhance the quality of your
research conclusions. If you need expert guidance, our team offers specialized
statistical consulting for research
to support every stage of your study — from design to publication.
Let us help you explore
data pooling techniques
and discover how they can strengthen your research outcomes.