Introduction
You’ve launched a new program, like a diet plan or a recovery method, and you see some good changes. But, when your team asks, “Did our work really make a difference?” you can’t rely on just looking at the charts. Guessing or “eyeballing” the results is risky and won’t stand up to serious questions from managers or regulators.
If you want to move your successful trial into official company guides, you need solid proof, not just a good feeling. This proof comes from using the right kind of math to check the data. This guide shows you the exact steps. That process starts with setting up a proper Intervention Study.
Defining the Intervention Study
An Intervention Study is a research design where the researcher actively introduces a variable (the intervention) and observes the outcome. Simply put, the researcher plays an active role in the course of events.
This directly contrasts with observational studies, where researchers merely watch and record natural events, such as comparing the outcomes between an existing case group and a control group. In those cases, the researcher does not interfere.
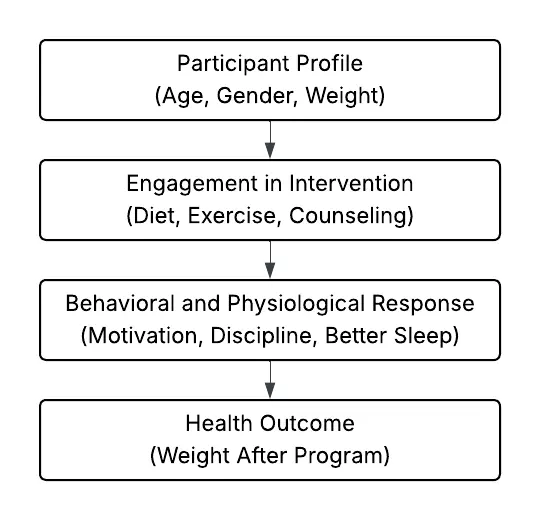
Figure 2. Conceptual Framework (Lucidchart)
Despite the simplicity of its core mechanism, the scope of an Intervention Study is broad. Treatments can range from preventative measures (like administering vitamin supplements or vaccines) to mitigation measures (like prescribing antibiotics). The applications are not purely medical, extending to counseling, therapeutic changes, and lifestyle programs. Furthermore, the unit of study can be highly variable, ranging from a small group of individuals to large groups like cities or provinces (often called “community trials”).
To illustrate these concepts, we will now conduct a practice analysis using a dummy dataset for an intervention study. This step-by-step process moves from data creation through to visualization and final results.
R TUTORIAL
Time to move from theory to R code. We’ll use a weight loss example to walk through every essential command, showing you exactly how to get that definitive proof that the program worked and identify the patient characteristics that predict success. For this practice intervention study, we have data on participant’s name, age, gender, and their weights before and after a hypothetical one-month exercise regime.
Step 1: RStudio
Open RStudio. This is our workspace for running the necessary R scripts.
Step 2: Create the Data
data <- data.frame(
  name = c("Anna", "Ben", "Chris", "Dana", "Ella", "Finn", "Grace", "Hugo", "Ivy", "Jake",
           "Kara", "Liam", "Mona", "Noah", "Olive", "Paul", "Quinn", "Ryan", "Sara", "Tom"),
  age = c(25, 32, 45, 28, 35, 40, 50, 31, 38, 29,
          27, 48, 42, 33, 36, 53, 30, 44, 26, 39),
  gender = c("F", "M", "M", "F", "F", "M", "F", "M", "F", "M",
             "F", "M", "F", "M", "F", "M", "F", "M", "F", "M"),
  before = c(82, 90, 95, 78, 84, 92, 88, 85, 80, 91,
             79, 97, 83, 94, 86, 100, 81, 89, 77, 93),
  after  = c(78, 86, 90, 75, 80, 87, 83, 82, 77, 88,
             75, 92, 79, 89, 82, 95, 78, 85, 73, 89)
)Step 3: Compute Weight Change
# Compute weight change (positive = weight lost)
data$weight_change <- data$before - data$after
head(data)The data should look like this.
Table 1. Sample Dataset
| Name | Age | Gender | Before (kg) | After (kg) | Weight Change (kg) |
| Anna | 25 | F | 82 | 78 | 4 |
| Ben | 32 | M | 90 | 86 | 4 |
| Chris | 45 | M | 95 | 90 | 5 |
| Dana | 28 | F | 78 | 75 | 3 |
| Ella | 35 | F | 84 | 80 | 4 |
| Finn | 40 | M | 92 | 87 | 5 |
| Grace | 50 | F | 88 | 83 | 5 |
| Hugo | 31 | M | 85 | 82 | 3 |
| Ivy | 38 | F | 80 | 77 | 3 |
| Jake | 29 | M | 91 | 88 | 3 |
| Kara | 27 | F | 79 | 75 | 4 |
| Liam | 48 | M | 97 | 92 | 5 |
| Mona | 42 | F | 83 | 79 | 4 |
| Noah | 33 | M | 94 | 89 | 5 |
| Olive | 36 | F | 86 | 82 | 4 |
| Paul | 53 | M | 100 | 95 | 5 |
| Quinn | 30 | F | 81 | 78 | 3 |
| Ryan | 44 | M | 89 | 85 | 4 |
| Sara | 26 | F | 77 | 73 | 4 |
| Tom | 39 | M | 93 | 89 | 4 |
Step 3: Generate Descriptive Statistics
summary(data[, c("before", "after", "weight_change")])The outcome should look like this.
Table 2. Descriptive Statistics
| Statistic | Before (kg) | After (kg) | Weight Change (kg) |
| Minimum | 77 | 73 | 3 |
| 1st Quartile | 81.75 | 78 | 3.75 |
| Median | 87 | 82.5 | 4 |
| Mean | 87.2 | 83.15 | 4.05 |
| 3rd Quartile | 92.25 | 88.25 | 5 |
| Maximum | 100 | 95 | 5 |
Step 4: Check for Significant Change (Wilcoxon Signed-Rank Test)
wilcox_result <- wilcox.test(data$after, data$before, paired = TRUE, exact = FALSE)
wilcox_resultThe outcome should look like this.
Wilcoxon signed rank test with continuity correction

data: data$after and data$before
V = 0, p-value = 7.428e-05
alternative hypothesis: true location shift is not equal to 0Interpretation: If p < 0.05, the change in weights before vs. after is statistically significant.
Step 5: Calculate the Effect Size
p_val <- wilcox_result$p.value
z_val <- qnorm(p_val / 2, lower.tail = FALSE)
r_effect <- z_val / sqrt(nrow(data))
r_effectThe outcome should look like this.
[1] 0.8859592Interpretation: r ≈ 0.1 small, 0.3 medium, 0.5 large.
Step 6: Explore Predictors of Improvement (Multivariable Regression)
model <- lm(weight_change ~ age + gender + before, data = data)
summary(model)The outcome should look like this.
Table 3. Multivariable Regression
| Predictor | Estimate (Coefficient) | Standard Error | t value | P-value |
| (Intercept) | -6.18197 | 3.44364 | -1.795 | 0.0915. |
| age | 0.01095 | 0.02356 | 0.465 | 0.6482 |
| genderM | -0.83161 | 0.49895 | -1.667 | 0.115 |
| before | 0.11752 | 0.04873 | 2.412 | 0.0283* |
Interpretation: A positive coefficient means the predictor is linked to greater weight loss; a negative one means less. Predictors with p < 0.05 have a significant effect.
Step 7: Visualize the Change (Boxplot)
# Fix margin error if the plot window is too small
par(mar = c(5, 5, 4, 2) + 0.1)

boxplot(data$before, data$after,
        names = c("Before", "After"),
        main = "Weight Before and After the Program",
        ylab = "Weight (kg)",
        col = c("lightblue", "lightgreen"))
grid()The outcome should look like this.
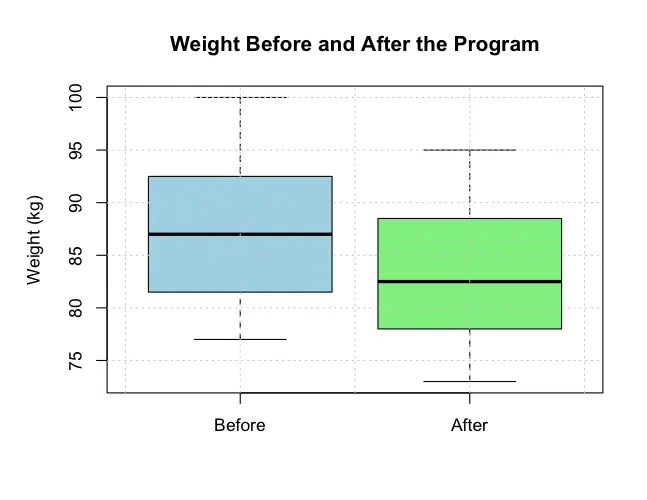
Figure 3. Boxplot
Interpretation: Compare the medians and spread between groups to see overall changes in weight.
Key Data Requirements for Your Intervention Study
So, exactly what kind of data do we need to perform an intervention study? In order for a robust experiment, there need to be exactly three components:
- A Clear Intervention: This is the specific action, treatment, or program being tested. Think of it as the ‘thing you did’ to the patient, whether it was a new drug, a surgical procedure, or a counseling session.
- Paired Measurements: Since the analysis is a paired test, the basic requirement is measuring the same participants before and after the intervention. This is known as a pre-post design. For example, you must record a patient’s heart rate when they start the intervention and their heart rate again when they finish it.
- Predictor Variables: The study aims to achieve two goals, testing for statistically significant differences in outcomes and identifying risk/protective factors for those outcomes, so data on participant characteristics such as age, gender, initial weight, and other baseline measures must be collected.
Together, these three components ensure your intervention study provides the strong data needed for clear results and confident decision-making.
And that concludes our look at a simple Intervention Study analysis. By combining the Wilcoxon Signed-Rank Test with Multivariable Regression, you move beyond the “Did it work?” question to identify the specific factors influencing success.
Knowing which statistical tools to use is just the first step. The true value lies in applying them correctly to messy, real-world data and translating the results into a clear strategy. If complex real-world datasets challenge your team, we offer comprehensive support designed to bridge the gap between theory and execution.
From Statistical Consulting for Research that shapes a robust study design, to dedicated Data Analysis that extracts actionable insights, we partner with you. Our goal is simple: to help you move forward with confidence and achieve your scientific and strategic objectives.