 Rowench Canon
Your marketing team has finally finished preparing the weekly report. Before the discussion even begins, new campaign data is already coming in.
For many multi-location businesses, this is a familiar routine. Marketing teams spend hours exporting reports from different advertising platforms, consolidating spreadsheets from multiple locations, and verifying that the data is accurate before it reaches decision-makers. As the business grows, so does the time required to produce a single report.
This guide explores how automated marketing dashboards help multi-location businesses save time by simplifying reporting, maintaining consistent data across locations, and creating a more efficient reporting process that supports better business decisions.
The Cost of Manual Reporting
The growing challenge isn’t the amount of marketing data but it is the reporting process behind it. Many businesses still rely on manual report exports, spreadsheet combinations, and data verification before they can begin analyzing campaign performance.
As new business locations, campaigns, and advertising platforms are added, the reporting workload grows alongside them. Preparing reports becomes increasingly time-consuming, leaving marketing teams with less time to identify trends, compare performance across locations, and optimize campaigns while they are still running.
The cost extends beyond the hours spent preparing reports. Manual reporting also increases the risk of inconsistencies, forcing teams to spend additional time checking data instead of acting on marketing insights. As businesses continue to grow, relying on manual reporting becomes increasingly difficult to sustain.

Benefits of Automation
Fortunately, manual reporting doesn’t have to be the norm. By automating the collection and organization of marketing data, businesses can reduce repetitive reporting tasks and spend more time understanding campaign performance rather than preparing reports.
Automation saves time in several ways. It reduces the effort required to produce reports, applies consistent reporting standards across locations, and provides faster access to marketing insights that support timely decision-making. As organizations continue to grow, streamlining the reporting process becomes increasingly important, allowing teams to focus more on improving campaigns than managing spreadsheets.
Spend More Time Improving Campaigns
Automation collects and organizes marketing data automatically, reducing the need to manually export reports and consolidate spreadsheets. With less time spent preparing reports, marketing teams can focus on optimizing campaigns and supporting business growth.
Build Confidence in Your Data
Reliable decisions depend on reliable data. Automated reporting applies consistent reporting rules, making it easier to compare marketing performance across locations while reducing errors caused by manual reporting.
Respond Faster to Performance Changes
Marketing performance changes every day. With timely access to current data, businesses can identify trends earlier, evaluate campaign performance more quickly, and adjust strategies before opportunities are missed.

Building a Centralized Reporting Workflow
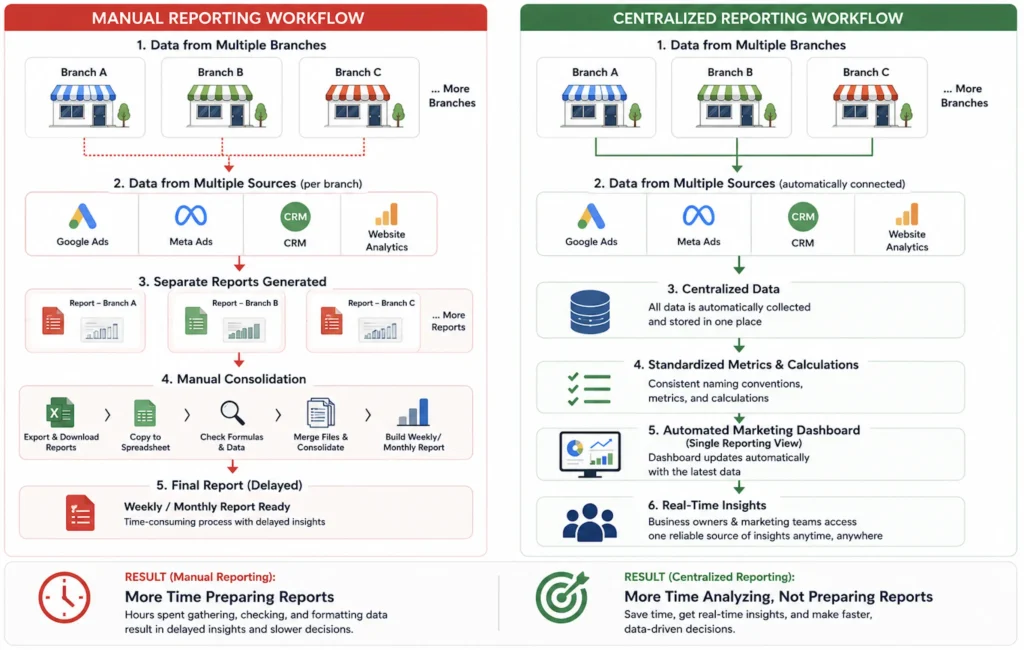
Once reporting has been automated, the next challenge is bringing all marketing data together. Instead of reviewing separate reports from every platform, businesses create a centralized workflow that collects, organizes, and prepares marketing data before it reaches the dashboard.
The workflow begins by collecting data from platforms such as Google Ads, Meta Ads, CRM systems, and website analytics into a centralized reporting source. Instead of working with separate reports, businesses consolidate marketing performance from every location into a single dataset.
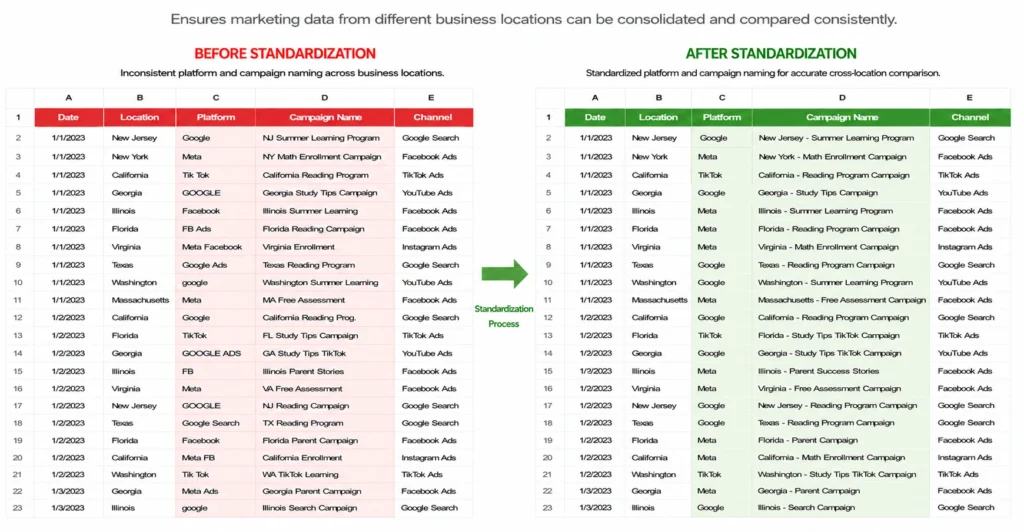
Before the data reaches the dashboard, it is standardized using consistent platform names, campaign naming conventions, and metric definitions. This creates a structured reporting process that prepares the data for accurate analysis and comparison.
Once the data has been organized, it can be displayed in an automated marketing dashboard, where business owners and marketing teams monitor performance from a single, reliable source rather than multiple reports.
Bringing marketing data together is only part of the solution. To produce meaningful reports, the data must be reported consistently across all business locations.
Keeping Data Consistent Across Locations
Bringing marketing data into one reporting workflow is only part of the solution. To produce meaningful reports, data must be collected and reported consistently across all business locations.
Small differences in reporting can quickly create larger problems. One location may record a platform as “Facebook Ads,” while another records it as “Meta – Facebook.” Campaign names, channels, or metric definitions may also vary between locations. Although they refer to the same marketing activities, these inconsistencies can separate data into different categories, making reports harder to compare and interpret.
Standardizing naming conventions, reporting structures, and metric definitions ensures that marketing data is organized consistently before it reaches the dashboard. With standardized data, businesses can compare performance across locations more accurately, identify trends with greater confidence, and rely on reports to support informed decision-making.
Once the data has been standardized, the final step is to present it in a way that makes marketing performance easy to understand and act on.
Best Practices for Automated Marketing Dashboards
A dashboard is only effective if it helps people quickly understand marketing performance. Rather than displaying every available metric, an effective dashboard highlights the information that matters most and presents it in a way that supports faster, more informed decisions.
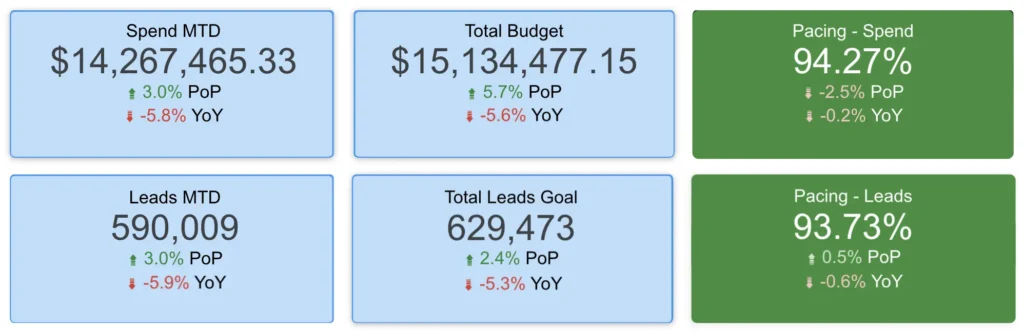
1. Show What Matters Most
Place key performance indicators (KPIs), such as advertising spend, leads, pacing, cost per lead (CPL), and return on investment (ROI), where they are immediately visible. A clear summary helps users understand overall performance before exploring detailed reports.
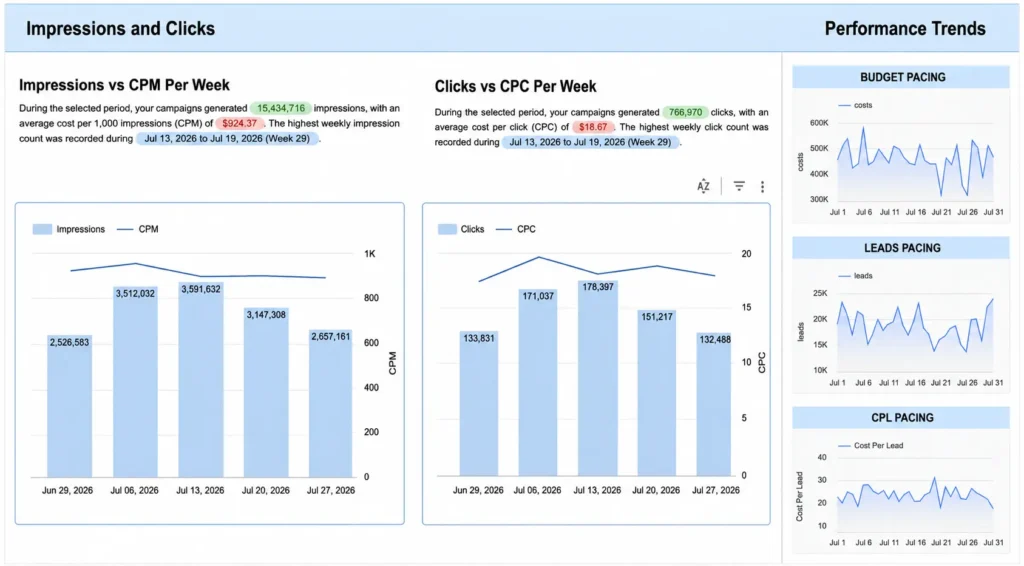
2. Visualize Performance Trends
Trend charts make it easier to monitor changes over time, helping businesses identify patterns, evaluate campaign performance, and respond to opportunities before they are missed.
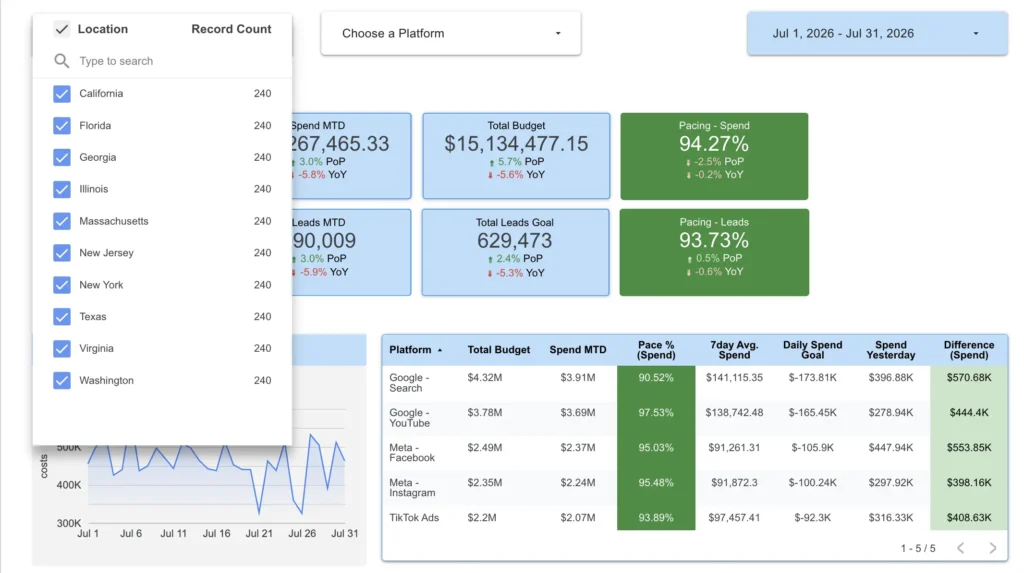
3. Make Reporting Interactive
Interactive filters for location, platform, campaign, and reporting period allow users to explore the same data from different perspectives without creating multiple reports.
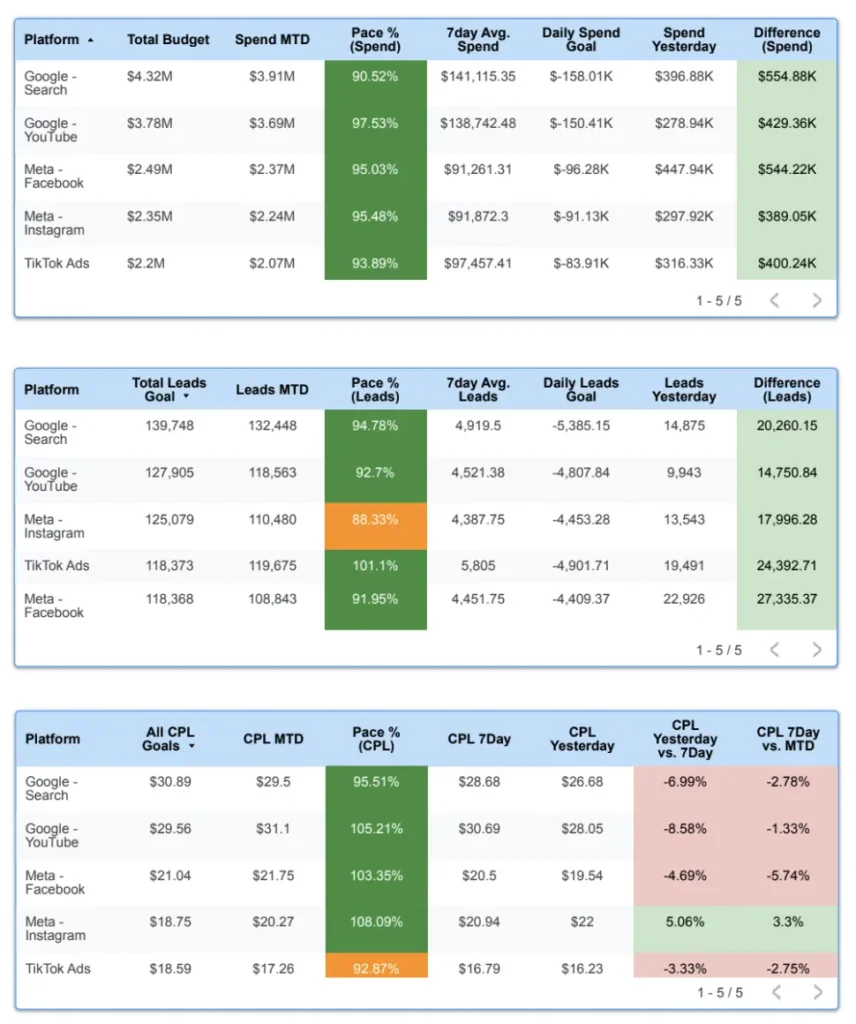
4. Support Deeper Analysis
Summary metrics provide an overview, while detailed tables explain the results. Breaking down performance by location, platform, or campaign helps businesses identify opportunities and make informed marketing decisions.
When dashboards are designed around business needs, they do more than present data. They help businesses make informed decisions.
Conclusion
Automated marketing dashboards have become an essential tool for businesses managing marketing performance across multiple locations. By reducing manual reporting, centralizing marketing data, and standardizing reporting practices, organizations can create a more efficient and reliable reporting process.
More importantly, automated reporting shifts the focus from preparing reports to making better decisions. Instead of wondering whether the latest report is ready, business owners and marketing teams can spend their time acting on insights while campaigns are still running.
For organizations looking to improve marketing reporting, automation helps teams work more efficiently while providing the reliable insights needed to support better business decisions and long-term growth.
At Data2Stats Consultancy Inc. we help organizations build automated marketing reporting solutions by developing interactive and dynamic dashboards, integrating marketing data from multiple platforms, and implementing reporting workflows that are accurate, scalable, and easy to maintain. Our goal is to help businesses spend less time preparing reports and more time making confident, data-driven decisions.