 James Gabriel Y. Edang
Imagine launching a marketing campaign that generates thousands of clicks, only to discover that competitors achieved better results with the same budget. Without a point of comparison, metrics such as Click-Through Rate (CTR), Cost Per Click (CPC), and Conversion Rate can be misleading. This is where marketing performance benchmarks become valuable.
Marketing performance benchmarks help businesses evaluate how their digital marketing efforts compare with industry standards. Instead of relying on isolated metrics, marketers can identify strengths, uncover opportunities for improvement, and make more informed, data-driven decisions. Whether you’re running Google Ads, Meta campaigns, email marketing, or lead generation initiatives, benchmarking provides the context needed to improve performance and maximize return on investment.
However, benchmarks vary across industries. Customer behavior, competition, and buying journeys differ significantly, meaning a strong conversion rate for a SaaS company may not represent success for an e-commerce business or a healthcare provider.
This guide explains what marketing performance benchmarks are, the key metrics businesses should monitor, how benchmark values differ across industries, and how to use these insights to evaluate and improve marketing performance.
What Are Marketing Performance Benchmarks?
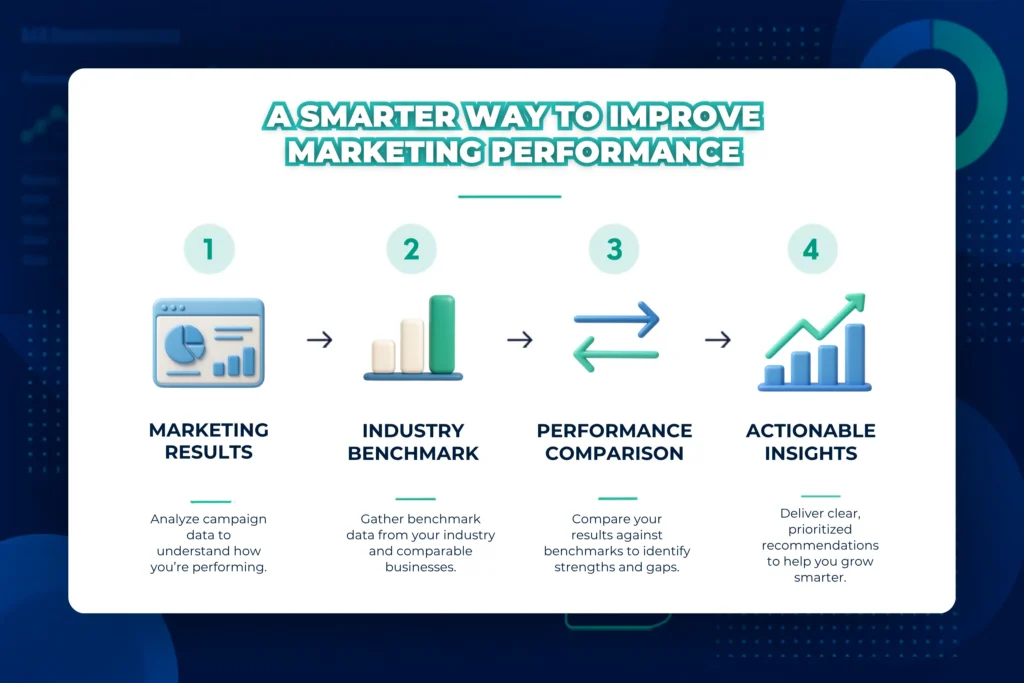
Marketing performance benchmarks are industry reference points that help businesses evaluate how well their marketing efforts are performing. Rather than viewing your metrics in isolation, benchmarks allow you to compare your results with those of similar organizations, providing valuable context for measuring success.
For example, a Google Ads campaign with a 4% conversion rate may appear successful. However, if the average conversion rate in your industry is 6%, there may be opportunities to improve your landing pages, targeting, or advertising strategy. If the industry average is 3%, your campaign is already outperforming many competitors. Benchmarks help transform isolated metrics into meaningful insights.
It is also important to distinguish benchmarks from business goals. A benchmark is an industry standard used for comparison, while a goal is a performance target your business aims to achieve. For example, if the average Cost Per Acquisition (CPA) in your industry is $40, your company may set a goal of reducing it to $30. The benchmark provides context, while the goal defines your desired outcome.
Businesses use marketing benchmarks to identify strengths, uncover improvement opportunities, allocate budgets more effectively, and monitor progress over time. When interpreted correctly, benchmarks support more informed, data-driven marketing decisions.
The Most Important Marketing Benchmark Metrics
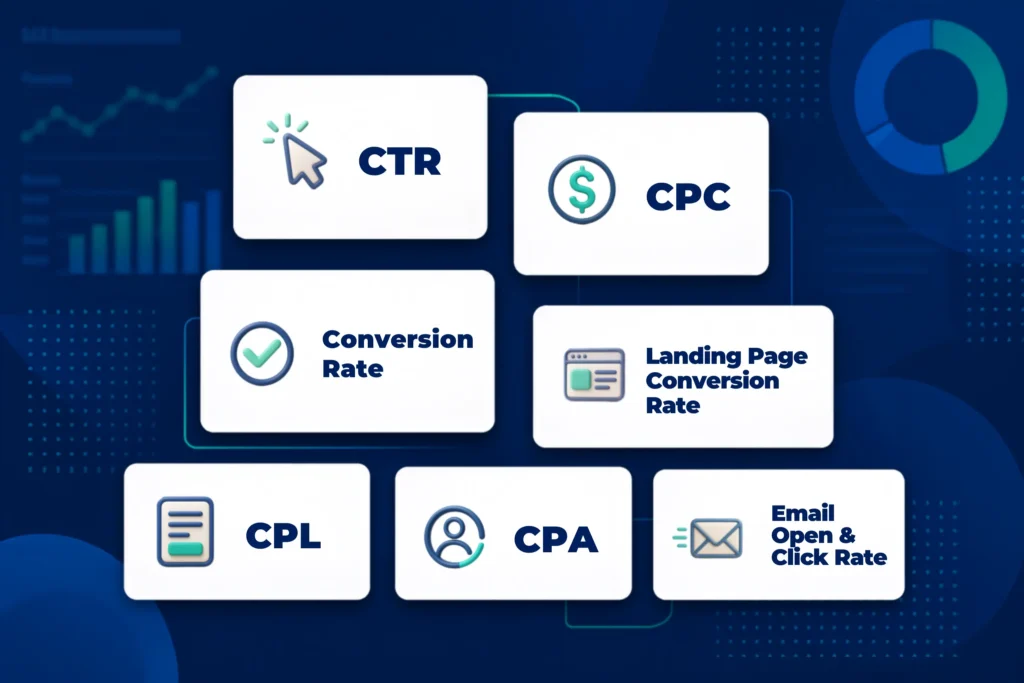
Marketing benchmark metrics are measurable indicators that help businesses evaluate campaign performance and compare results with industry standards. While organizations track different objectives, several core metrics consistently provide valuable insights into advertising efficiency, customer engagement, lead generation, and overall marketing effectiveness.
Click-Through Rate (CTR) measures the percentage of users who click an advertisement or link after seeing it, indicating how relevant your messaging is to your target audience. Cost Per Click (CPC) measures the average amount spent for each click, helping assess advertising efficiency across platforms such as Google Ads and Meta.
To measure campaign outcomes, businesses monitor Conversion Rate, which tracks the percentage of visitors who complete a desired action, such as making a purchase, booking an appointment, or submitting a form. Two additional metrics—Cost Per Lead (CPL) and Cost Per Acquisition (CPA)—measure the cost of generating qualified leads and acquiring paying customers, respectively.
Businesses that rely on websites and email marketing should also monitor Landing Page Conversion Rate, Email Open Rate, and Email Click Rate to evaluate how effectively webpages and email campaigns encourage audience engagement and conversions.
No single KPI tells the complete story. For example, a campaign with a low CPC may still underperform if its conversion rate is below the industry average, while a higher CPA may be acceptable when it attracts high-value customers. Evaluating multiple metrics together provides a more accurate picture of marketing performance and helps identify opportunities for improvement.
| Metric | What It Measures | Why It Matters |
|---|---|---|
| Click-Through Rate (CTR) | Percentage of users who click an ad after seeing it | Indicates how relevant and engaging your ads are |
| Cost Per Click (CPC) | Average amount paid for each ad click | Measures advertising efficiency and budget utilization |
| Conversion Rate | Percentage of visitors who complete a desired action | Indicates how effectively marketing campaigns drive results |
| Landing Page Conversion Rate | Percentage of landing page visitors who convert | Measures the effectiveness of landing page design and messaging |
| Cost Per Lead (CPL) | Average cost of generating one qualified lead | Helps evaluate lead generation efficiency |
| Cost Per Acquisition (CPA) | Average cost of acquiring one paying customer | Measures customer acquisition efficiency and return on marketing investment |
| Email Open Rate | Percentage of recipients who open an email | Indicates audience interest and subject line effectiveness |
| Email Click Rate | Percentage of recipients who click links within an email | Measures engagement with email content |
Table 1. Common Marketing Benchmark Metrics
Marketing Performance Benchmarks by Industry
Marketing performance benchmarks vary across industries because customer behavior, competition, buying journeys, and marketing objectives are different for every business. A metric that signals strong performance in one industry may be average—or below expectations—in another. For this reason, businesses should compare their results with organizations in the same industry rather than across unrelated sectors.
For example, healthcare providers focus on generating qualified patient inquiries and building trust before appointments are booked, while e-commerce businesses prioritize converting online shoppers into immediate purchases. Similarly, Software as a Service (SaaS) companies typically have longer sales cycles than home service businesses, resulting in different marketing priorities and benchmark values.
Industry-specific benchmarks provide more meaningful comparisons by reflecting the unique characteristics of each market. Rather than asking whether a Click-Through Rate (CTR), Cost Per Click (CPC), or Conversion Rate is “good” in general, businesses should evaluate these metrics against organizations with similar audiences, products, and business models.
The following sections examine benchmark insights across seven industries—Dental, Medical, Home Services, SaaS, Education, E-commerce, and Professional Services—to help businesses better understand their marketing performance and identify opportunities for improvement.
| Industry | Primary Marketing Goal | Most Important KPIs |
|---|---|---|
| Dental | Generate patient appointments | CTR, CPC, CPL, CPA, Landing Page Conversion |
| Medical | Acquire qualified patient inquiries | CTR, CPC, CPL, CPA, Landing Page Conversion |
| Home Services | Generate service requests | CTR, CPC, Conversion Rate, CPL, CPA |
| SaaS | Generate product trials and subscriptions | CTR, CPC, Conversion Rate, CPL, CPA |
| Education | Generate student inquiries and enrollments | CTR, CPC, CPL, CPA, Email Metrics |
| E-commerce | Increase online purchases | CTR, CPC, Conversion Rate, CPA |
| Professional Services | Acquire qualified consulting leads | CTR, CPC, CPL, CPA, Email Metrics |
Table 2. Marketing Performance Benchmarks by Industry (2026)
Dental Industry Benchmarks
Marketing performance benchmarks for dental clinics differ because patients rarely make impulsive decisions when choosing a healthcare provider. Trust, reputation, location, and treatment costs all influence patient decisions, making qualified appointment inquiries more valuable than website traffic alone.
Key performance indicators (KPIs) help dental clinics evaluate marketing effectiveness. Click-Through Rate (CTR) measures how effectively advertisements attract potential patients, while Cost Per Click (CPC) indicates advertising efficiency. Landing Page Conversion Rate shows how well a website converts visitors into appointment requests or inquiries. Dental clinics should also monitor Cost Per Lead (CPL) and Cost Per Acquisition (CPA) to evaluate the efficiency of acquiring prospective and paying patients. For email campaigns, dental organizations typically achieve an Email Open Rate of 22.5% and an Email Click Rate of 2.9%, providing additional insight into patient engagement.
According to benchmark research, dental campaigns typically achieve a Meta CTR of 0.98%, a Google Ads CPC of $5.44, a Landing Page Conversion Rate of 4.8%, a CPL of $27.66, and a CPA of $38.17. These figures should be used as reference points rather than fixed performance targets, as competition, location, and campaign objectives vary across practices.
When interpreting results, clinics should evaluate multiple metrics together. A higher CPC may still produce excellent results if it generates qualified patient appointments at an efficient acquisition cost. Optimizing landing pages, simplifying appointment booking, and refining ad messaging can often improve overall performance more effectively than simply increasing advertising spend.
The healthcare sector extends beyond dental practices, and medical organizations face different patient journeys and marketing priorities. These differences are reflected in their benchmark values and performance expectations.
Medical Industry Benchmarks
Marketing performance benchmarks for medical organizations differ because healthcare decisions often involve greater consideration than many other purchases. Patients typically research providers, compare treatment options, verify credentials, and review insurance coverage before scheduling an appointment. As a result, successful campaigns prioritize building trust and generating qualified patient inquiries.
Medical organizations should monitor the same core KPIs introduced earlier, with particular attention to CTR, CPC, Landing Page Conversion Rate, CPL, and CPA. These metrics help evaluate advertising effectiveness, website performance, lead generation efficiency, and patient acquisition. Organizations that use email marketing typically achieve an Email Open Rate of 23.1% and an Email Click Rate of 3.1%, helping evaluate engagement with appointment reminders, health education, and follow-up communications.
According to benchmark research, medical organizations typically achieve a Meta CTR of 0.98%, a Google Ads CPC of $6.73, a Landing Page Conversion Rate of 4.8%, a CPL of $27.66, and a CPA of $38.17. While advertising costs are relatively high due to competition in the healthcare sector, these values should be treated as reference points rather than fixed targets.
When evaluating campaign performance, marketers should consider multiple KPIs together. A higher CPC may still produce strong results if it generates qualified patient appointments at an efficient acquisition cost. Continuous improvements to ad messaging, patient-focused landing pages, and appointment scheduling can often have a greater impact than increasing advertising budgets alone.
Unlike healthcare organizations, home service businesses typically market to customers with immediate needs and shorter buying journeys, resulting in different benchmark expectations.
Home Services Industry Benchmarks
Marketing performance benchmarks for home service businesses differ because customers often need immediate solutions. Whether searching for a plumber, electrician, HVAC technician, or roofing contractor, they typically have high purchase intent and are ready to act quickly. As a result, marketing campaigns focus on generating qualified leads efficiently rather than simply increasing website traffic.
Home service businesses should monitor the core KPIs discussed earlier, particularly CTR, CPC, Landing Page Conversion Rate, CPL, and CPA. These metrics help evaluate advertising effectiveness, lead generation efficiency, and customer acquisition. Businesses using email marketing typically achieve an Email Open Rate of 24.8% and an Email Click Rate of 2.5%, helping evaluate engagement with follow-up campaigns, maintenance reminders, and seasonal promotions.
According to benchmark research, home service businesses typically achieve a Meta CTR of 0.80%, a Google Ads CPC of $6.47, a Landing Page Conversion Rate of 4.6%, a CPL ranging from $30 to $50, and a CPA of approximately $90.70. Although customer acquisition costs can be relatively high, they are often justified by the value of completed service jobs and long-term customer relationships. These benchmarks should be treated as reference points, as local competition and market conditions can significantly influence results.
To improve performance, businesses should optimize local search visibility, create clear calls to action, simplify quote request forms, and respond promptly to customer inquiries. Even small improvements to website experience and lead response time can significantly increase conversions and reduce acquisition costs.
Unlike home service businesses, SaaS companies typically have longer sales cycles and more complex buying decisions, resulting in a different set of marketing benchmarks.
SaaS Industry Benchmarks
Marketing performance benchmarks for Software as a Service (SaaS) companies differ because purchasing software often involves a longer and more complex buying process. Prospective customers typically research products, request demonstrations or free trials, compare alternatives, and obtain internal approvals before making a purchase. As a result, SaaS marketing focuses on generating and nurturing qualified leads rather than driving immediate sales.
SaaS companies should monitor the core KPIs discussed earlier, particularly CTR, CPC, Landing Page Conversion Rate, CPL, and CPA. These metrics measure advertising performance, lead generation efficiency, and customer acquisition. SaaS companies typically achieve an Email Open Rate of 19.5% and an Email Click Rate of 2.1%, providing additional insight into the effectiveness of lead nurturing campaigns.
According to benchmark research, SaaS companies typically achieve a Meta CTR of 1.13%, a Google Ads CPC of $3.80, a Landing Page Conversion Rate of 3.0%, a CPL ranging from $29 to $31, and a CPA of approximately $133.52. While the CPC is relatively moderate, the higher CPA reflects the longer sales cycle and additional effort required to convert prospects into paying customers. These benchmarks should be interpreted alongside customer lifetime value, pricing, and revenue potential.
To improve marketing performance, SaaS companies should optimize landing pages, simplify trial or demo sign-up processes, nurture leads through targeted email campaigns, and continuously test messaging that clearly communicates product value. Small improvements throughout the customer journey can significantly increase conversions and reduce acquisition costs over time.
Unlike SaaS companies, educational institutions focus on guiding prospective students through the enrollment process, resulting in different marketing objectives and benchmark expectations.
Education Industry Benchmarks
Marketing performance benchmarks for educational institutions differ because enrolling a student is typically a longer decision-making process than making a one-time purchase. Prospective students and parents often research programs, compare institutions, attend information sessions, and seek additional guidance before enrolling. As a result, marketing campaigns prioritize generating qualified inquiries and nurturing prospective students throughout the enrollment journey.
Educational institutions should monitor the core KPIs discussed earlier, particularly CTR, CPC, Landing Page Conversion Rate, CPL, and CPA. Since email is a key communication channel throughout the admissions process, Email Open Rate and Email Click Rate are also important indicators of engagement and lead nurturing.
According to benchmark research, education campaigns typically achieve a Meta CTR of 1.4%–1.7%, a Google Ads CPC of $5.74, a Landing Page Conversion Rate of 5.8%, a CPL of approximately $23.10, and a CPA of approximately $38.17. The sector also records strong email engagement, with an Email Open Rate of 25.2% and an Email Click Rate of 3.8%. These figures should be used as reference points rather than fixed targets, as performance varies by institution type, program offerings, and recruitment strategy.
To improve results, educational institutions should create clear admissions landing pages, simplify inquiry forms, personalize follow-up emails, and provide valuable content that supports prospective students throughout the enrollment process. Monitoring performance across multiple touchpoints helps identify opportunities to improve both lead generation and student conversion.
Unlike educational institutions, e-commerce businesses typically operate in fast-paced buying environments where success depends on converting online shoppers quickly and efficiently.
E-commerce Industry Benchmarks
Marketing performance benchmarks for e-commerce businesses differ because the customer journey is typically fast and highly transactional. Shoppers can move from product discovery to purchase within minutes while comparing prices, products, and reviews across multiple retailers. As a result, marketing success depends on attracting qualified traffic and converting visitors into customers efficiently.
E-commerce businesses should monitor the core KPIs discussed earlier, particularly CTR, CPC, Landing Page Conversion Rate, and CPA. While CPL may still be relevant for some campaigns, CPA is often a more important measure of marketing efficiency because it reflects the cost of generating completed purchases. Businesses using email marketing should also track Email Open Rate and Email Click Rate to evaluate customer engagement with promotions, product launches, and abandoned cart campaigns.
According to benchmark research, e-commerce campaigns typically achieve a Meta CTR of 4.13%, Meta CPC of $0.34, Google Ads CPC of $1.16, Landing Page Conversion Rate of 4.2%, CPL of approximately $27.66, and CPA of approximately $45.27. The report also notes a relatively lower Email Open Rate of 16.8% and an Email Click Rate of 2.0%, reflecting the competitive nature of promotional email marketing. These values should be used as reference points rather than fixed performance targets, as results vary by product category, average order value, and customer retention strategies.
To improve performance, businesses should optimize product pages, streamline the checkout process, personalize email campaigns, and continuously test advertising creatives. Evaluating multiple KPIs together provides a more accurate picture of marketing performance than relying on any single metric.
Unlike e-commerce businesses, professional service firms focus on generating qualified leads and building long-term client relationships, resulting in different marketing priorities and benchmark expectations.
Professional Services Industry Benchmarks
Marketing performance benchmarks for professional service firms differ because clients typically make high-value decisions only after evaluating a provider’s expertise, credibility, and experience. Whether offering legal, accounting, financial, engineering, or consulting services, these businesses rely on generating qualified leads and building long-term client relationships rather than driving large volumes of website traffic.
Professional service firms should monitor the core KPIs discussed earlier, particularly CTR, CPC, Landing Page Conversion Rate, CPL, and CPA. These metrics measure advertising effectiveness, lead generation efficiency, and customer acquisition. Firms that use email marketing should also track Email Open Rate and Email Click Rate to evaluate engagement with newsletters, educational content, and client communications.
According to benchmark research, professional service firms typically achieve a Meta CTR of 1.13%, a Google Ads CPC of $5.58, a Landing Page Conversion Rate of 6.1%, a CPL of approximately $93.69, and a CPA of approximately $116.13. The industry also records a strong Email Open Rate of 21.7% and an Email Click Rate of 2.7%, reflecting the value clients place on relevant, informative content. Although customer acquisition costs are among the highest across the industries analyzed, they are often justified by the substantial lifetime value of each client. These benchmarks should therefore be interpreted alongside service pricing, client retention, and long-term profitability.
To improve marketing performance, firms should establish credibility through high-quality content, optimize landing pages, simplify consultation requests, and consistently nurture leads with valuable educational resources. Tracking benchmark metrics over time helps identify performance gaps, allocate marketing budgets more effectively, and strengthen client acquisition strategies.
| Industry | Meta CTR | Google CPC | Landing Page Conv. | CPL | CPA | Email Open Rate | Email Click Rate |
|---|---|---|---|---|---|---|---|
| Dental | 0.98% | $5.44 | 4.8% | $27.66 | $38.17 | 22.5% | 2.9% |
| Medical | 0.98% | $6.73 | 4.8% | $27.66 | $38.17 | 23.1% | 3.1% |
| Home Services | 0.80% | $6.47 | 4.6% | $30–50 | $90.70 | 24.8% | 2.5% |
| SaaS | 1.13% | $3.80 | 3.0% | $29–31 | $133.52 | 19.5% | 2.1% |
| Education | 1.4–1.7% | $5.74 | 5.8% | $23.10 | $38.17 | 25.2% | 3.8% |
| E-commerce | 4.13% | $1.16 | 4.2% | $27.66 | $45.27 | 16.8% | 2.0% |
| Professional Services | 1.13% | $5.58 | 6.1% | $93.69 | $116.13 | 21.7% | 2.7% |
Table 3. Summary of Industry Benchmark Values (2026)
How to Compare Your Performance Against Benchmarks
Comparing your marketing performance against benchmarks means evaluating your marketing metrics against industry averages or established standards. Rather than assessing campaign results in isolation, benchmarking helps determine whether your performance is above, below, or in line with similar businesses, making it easier to identify strengths and opportunities for improvement.
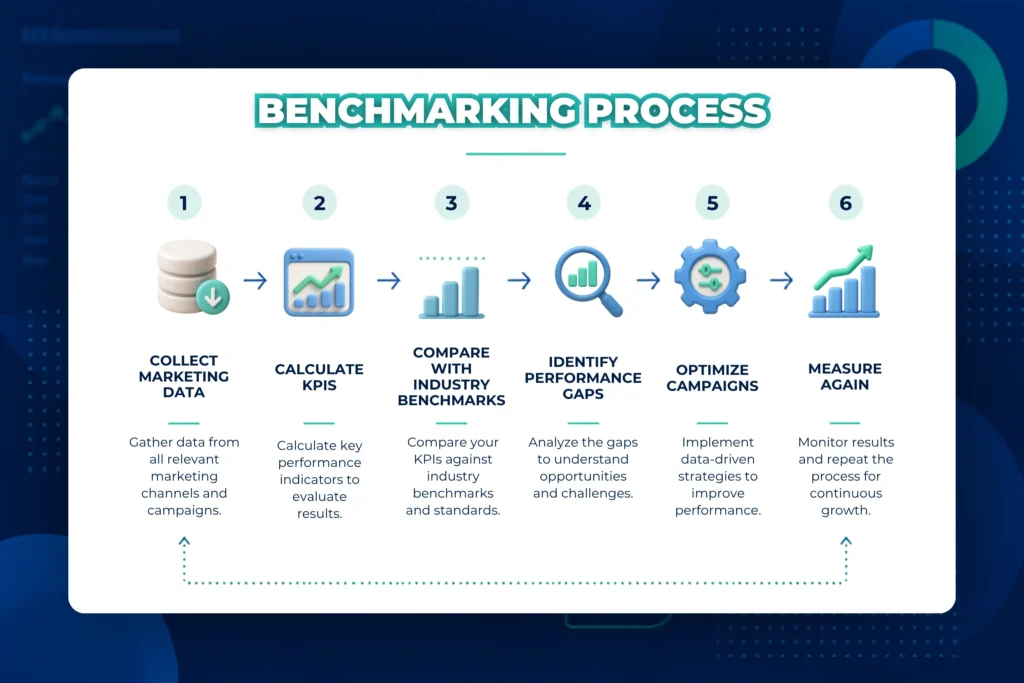
Start by collecting marketing data from platforms such as Google Ads, Meta Ads, Google Analytics, email marketing software, or your customer relationship management (CRM) system. Then calculate the KPIs most relevant to your business, including CTR, CPC, Conversion Rate, CPL, and CPA.
Next, compare your results with benchmarks that match your industry. For example, if an e-commerce business achieves a CPC below the industry average while maintaining a strong conversion rate, it may indicate efficient advertising performance. Conversely, a home service company with a CPA well above the industry benchmark may need to improve its targeting, landing pages, or lead qualification process.
Remember that benchmarks are reference points—not business goals. While a benchmark reflects typical industry performance, your business goals should align with your own objectives and growth strategy. For example, if the average email open rate in your industry is 20%, your organization may set a goal of reaching 25% through better subject lines and audience segmentation.
Benchmarking should be an ongoing process. Regularly monitoring your performance, comparing it with updated industry benchmarks, and refining your marketing strategies enables your business to adapt to changing market conditions and continuously improve results.
Common Mistakes When Using Marketing Benchmarks
Marketing benchmarks are valuable tools for evaluating performance, but they should be used as reference points rather than fixed targets. Misinterpreting benchmark data can lead to unrealistic expectations and ineffective marketing decisions.
One common mistake is comparing performance across different industries. Customer behavior, competition, and buying journeys vary significantly, so comparing an e-commerce business with a professional service firm can produce misleading conclusions. Always use benchmarks that reflect your own industry and business model.
Another mistake is treating benchmarks as business goals. Benchmarks represent average industry performance, while goals should be based on your organization’s objectives, resources, and growth strategy. For example, if the average Cost Per Acquisition (CPA) is $40, your business may set a goal of reducing it to $30.
Businesses also make the mistake of focusing on a single KPI. A campaign with a high Click-Through Rate (CTR) may still perform poorly if it generates few conversions or has an unsustainable CPA. Evaluating multiple KPIs together provides a more accurate picture of overall marketing performance.
Finally, relying on outdated benchmark data can result in inaccurate comparisons. As digital marketing platforms, competition, and consumer behavior continue to evolve, businesses should regularly review updated benchmark reports to ensure their evaluations remain relevant.
When used correctly, marketing benchmarks help businesses identify opportunities for improvement, make informed decisions, and continuously optimize marketing performance.
| Common Mistake | Better Practice |
|---|---|
| Comparing with businesses from different industries | Compare against organizations with similar business models and target markets |
| Treating benchmarks as fixed goals | Use benchmarks as reference points while setting business-specific goals |
| Focusing on only one KPI | Evaluate multiple KPIs together for a complete performance assessment |
| Using outdated benchmark data | Review the latest benchmark reports regularly |
| Ignoring campaign objectives | Compare metrics within the context of campaign goals |
Table 4. Common Benchmarking Mistakes and Recommended Practices
When used correctly, marketing benchmarks serve as practical reference points that support informed decision-making. By comparing the right metrics, using current data, and evaluating performance within the appropriate context, businesses can identify opportunities for improvement and make more confident, data-driven marketing decisions.
How Data2Stats Helps Businesses Benchmark Marketing Performance
Marketing benchmarks are most valuable when they are interpreted correctly and translated into actionable strategies. While businesses can access marketing data through platforms such as Google Ads, Meta Ads, Google Analytics, and email marketing tools, understanding what those metrics mean—and how they compare with industry standards—requires more than simply viewing reports.
Data2Stats helps businesses transform raw marketing data into meaningful insights through its Digital Marketing Analytics services. Businesses looking to improve overall marketing efficiency can also explore Data2Stats’ Operational Optimization Solutions, which help streamline business processes and improve organizational performance. By measuring, collecting, analyzing, and reporting data across websites, social media, email campaigns, and paid advertising, Data2Stats enables organizations to evaluate marketing performance and make informed, data-driven decisions.
Its services include Performance Metrics Analysis, which evaluates key indicators such as clicks, impressions, conversions, and return on investment (ROI); Audience Segmentation, which helps businesses better understand customer demographics and behavior; Campaign Optimization, which provides recommendations to improve targeting, messaging, and budget allocation; and Competitor Analysis, which benchmarks performance against competitors to identify strengths, opportunities, and areas for improvement.
These insights help businesses maximize campaign ROI, better understand their customers, optimize conversion paths, and stay competitive in an evolving digital landscape. By combining industry benchmarks with business-specific performance data, Data2Stats empowers organizations to continuously refine their marketing strategies and make evidence-based decisions with greater confidence. Learn more about Data2Stats’ Data Analysis services.
Conclusion
Marketing performance benchmarks provide businesses with the context needed to interpret marketing results and make smarter, data-driven decisions. By comparing key performance indicators such as CTR, CPC, Conversion Rate, CPL, and CPA against relevant industry benchmarks, organizations can better understand where they are performing well and where improvements are needed.
However, benchmarks should be viewed as reference points rather than fixed targets. Every business has unique goals, budgets, audiences, and competitive conditions, so success should be evaluated using multiple KPIs rather than a single metric. Regular benchmarking also helps organizations adapt to changing customer behavior and an evolving digital marketing landscape.
Whether you operate a dental clinic, medical practice, home service business, SaaS company, educational institution, e-commerce store, or professional service firm, benchmarking enables you to identify opportunities, optimize campaigns, and allocate marketing resources more effectively.
Combined with continuous performance analysis and data-driven decision-making, marketing benchmarks become a valuable tool for improving campaign effectiveness and achieving sustainable business growth.