Introduction
Clinical trials are structured research studies designed to evaluate how new medical treatments, drugs, or interventions performed in humans. They follow a systematic process divided into multiple phases. Phase I clinical trials mark the critical first step in this process. Their primary goal is to assess a drug’s safety, tolerability, and pharmacokinetic profile. These early findings form the foundation for all subsequent phases.
How is Data Validated in Phase I Clinical Trials?
In Phase I, data plays a central role in validating safety and tolerability. Every observation, from lab results and vital signs to adverse event reports is captured, summarized, and analyzed using robust statistical methods. Through descriptive statistics, survival analysis, and comparative tests, researchers can quantify potential risks, identify early safety signals, and determine whether dose levels remain within safe limits.
Selection Guidelines for Phase I Trial Participants
The Phase I clinical trial starts by establishing a well-defined eligibility criteria for the recruitment of volunteers. These criteria ensure that participants, whether healthy volunteers or specific patient populations, are suitable for early-stage testing and can provide reliable safety data. Inclusion and exclusion rules typically consider age, sex, body mass index, baseline laboratory values, medical history, and use of medications or substances that could interfere with the investigational drug.
Recruitment must be guided by both scientific and statistical considerations to ensure that results are robust and generalizable. Selecting participants who represent the target physiological range helps capture meaningful variability in drug metabolism and tolerability while maintaining control over confounding factors.
Interventions in Early Trials
The intervention phase of a Phase I clinical trial involves administering the investigational drug under carefully controlled conditions. Dosing typically follows a dose-escalation design, beginning with a very low dose to minimize potential risk. Participants are treated in small groups, and subsequent cohorts receive higher doses only after safety data from the preceding group have been reviewed. This stepwise approach enables researchers to identify the maximum tolerated dose (MTD) and establish the drug’s pharmacokinetic and pharmacodynamic profile. Data integrity is central at this stage. Each administration should be precisely documented, including dosage level, timing, route of administration, and participant response.
Monitoring Participant Responses in Phase I
Once dosing begins, continuous monitoring becomes the cornerstone of a Phase I clinical trial. Participants are closely observed for any physiological or clinical changes that may indicate adverse reactions. Standard safety parameters such as vital signs, laboratory test results, electrocardiograms (ECGs), and clinical assessments are collected at scheduled intervals and compared against baseline values to detect early safety signals.
To ensure data reliability, all observations are systematically logged in electronic data capture (EDC) systems, with built-in validation checks and time stamps for traceability. Adverse events are typically recorded using standardized coding systems like MedDRA.
Collecting and Recording Data in Phase I Trials
Systematic data collection in Phase I Clinical Trials refers to gathering clinical trial data in a standardized, structured, and traceable manner throughout the study lifecycle. Data collection is extremely important; every data point whether from lab results, vital signs, electronic diaries, or wearable sensors is time-stamped, validated, and linked to a unique participant record.
In the past decade, clinical trial data collection in Phase I Clinical Trials has shifted from largely manual, paper-based processes to digitally integrated, real-time systems.
Common systems include:
- Electronic Data Capture (EDC): Software platforms for collecting, managing, and storing clinical trial data electronically.
- Electronic Health Records (EHR) integration: EHR integration links Phase I trial with existing patient health records to streamline data collection and reduce duplication.
- Remote and decentralized data sources: Decentralized data collection in Phase I Clinical Trials uses digital tools such as mobile applications, wearable sensors, and telemedicine platforms to gather information directly from participants outside traditional clinical sites. These systems capture continuous physiological data (e.g., heart rate, sleep, activity) and real-time patient-reported outcomes.
Data Analysis in Phase I Clinical Trials
Using statistical methods, researchers analyze collected data from Phase I Clinical Trials to evaluate safety and efficacy outcomes. The analysis includes:
- Descriptive statistics to summarize participant demographics, baseline characteristics, and overall study outcomes using measures such as mean, median, standard deviation, and percentages.
- Descriptive statistics for adverse events to report the frequency, severity, and relationship of adverse events to the intervention in Phase I Clinical Trials.
- Kaplan-Meier survival analysis to estimate time-to-event outcomes, such as time to first adverse event.
- Fisher’s exact test or Chi-square test to compare categorical variables, including the incidence of adverse events, between treatment groups in Phase I Clinical Trials.
Ethical Considerations in Phase I Clinical Trials
The ethical considerations for clinical trials center on protecting participant rights, ensuring data integrity, and maintaining rigorous scientific standards.
Key Ethical Considerations:
- Respect for Participant Autonomy: Obtain genuine informed consent
- Beneficence: Minimize harm and maximize potential benefits to participants
- Justice: Ensure equal access and fair treatment in research
- Data Integrity: Prevent potential violations like P-hacking and selective reporting
- Risk Management: Carefully assess potential risks, especially in Phase I trials with unknown drug effects
- Privacy Protection: Safeguard participant personal and medical information
How to Analyze Data from Phase I Clinical Trials
- Define the study purpose. Phase I clinical trials primarily assess the safety, tolerability, and pharmacokinetic properties of a new drug. The goal is to identify the maximum tolerated dose and establish a recommended dose for future studies.
- Prepare the analysis dataset. Include all participants who received at least one dose of the investigational product. Define clear analysis populations such as safety-evaluable, pharmacokinetic-evaluable, and dose-limiting toxicity (DLT)-evaluable sets.
- Use descriptive statistics. Summarize baseline characteristics, demographics, and laboratory parameters. Report continuous variables using mean, median, standard deviation, and range; summarize categorical variables using counts and percentages.
- Apply descriptive statistics for adverse events. Categorize and summarize adverse events by system organ class and preferred term. Report the number and percentage of participants who experienced each event, grouped by severity (grade) and relationship to the study drug. Highlight serious adverse events and those leading to dose modification or discontinuation.
- Use Kaplan-Meier survival analysis. Estimate and visualize time-to-event outcomes such as time to first adverse event, time to dose-limiting toxicity, or time to treatment discontinuation. Display Kaplan-Meier curves with confidence intervals and number at risk tables to show event distribution over time.
- Apply Fisher’s exact test or Chi-square test. Compare the incidence of categorical outcomes such as the proportion of participants with any adverse event between dose groups. Use Fisher’s exact test for small sample sizes and Chi-square test when data are sufficient. Report p-values and confidence intervals but interpret results descriptively due to limited statistical power in Phase I studies.
- Interpret the findings. Emphasize patterns and dose-related trends rather than statistical significance. Focus on the clinical relevance of adverse events, pharmacokinetic results, and safety signals that inform dose selection.
- Document and report clearly. Present data in well-structured tables and figures, including baseline summaries, adverse event tables, Kaplan-Meier curves, and PK parameter summaries. Ensure transparency and reproducibility by specifying all statistical methods and software used.
Sample Implementation Using R
This tutorial explores how safety and tolerability are evaluated in a Phase I clinical trial using simulated data from 48 healthy volunteers randomized to Drug A (a new anti-inflammatory) or placebo. We will guide you through:
- installing R/RStudio and required packages,
- importing and preparing the dataset,
- summarizing baseline characteristics, and
- describing adverse events.
Note: The dataset used is simulated and simplified for educational purposes. Real clinical trials require more complex data, regulatory standards, and analytical methods.
Step 1. Install the latest version of R and RStudio
Step 2. Load required R packages. You may skip this step if the packages are already loaded into your R library.
install.packages(c("tidyverse", "tableone", "dplyr", "survival", "survminer", "readr", "kableExtra"))

library(tidyverse)
library(tableone)
library(dplyr)
library(survival)
library(survminer)
library(readr)
library(kable)Note that in this example, we use the kable library to create clean, well-formatted tables in R Markdown. However, this step is optional.
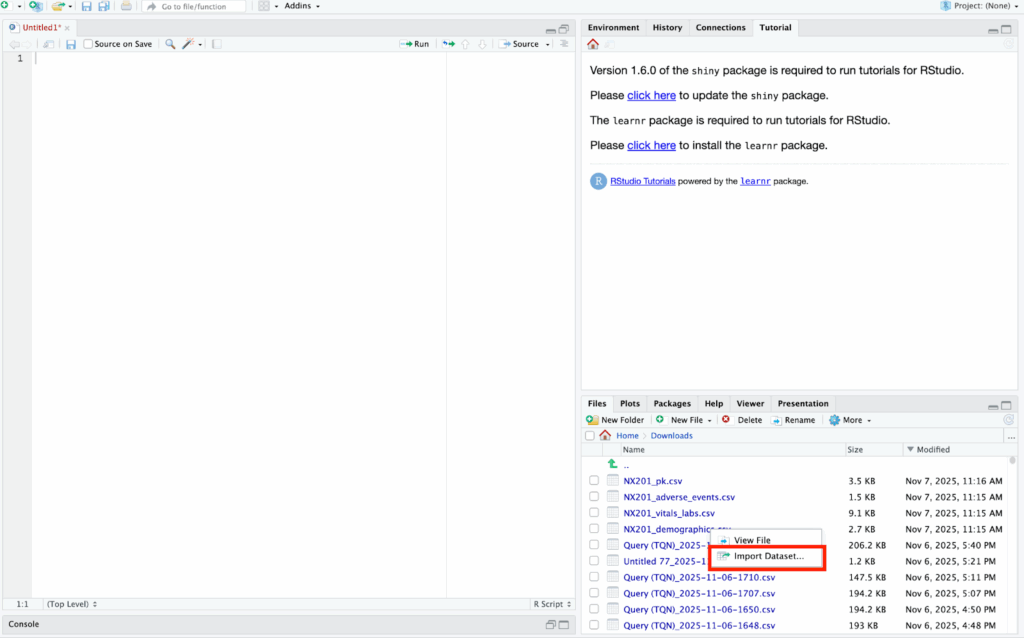
Step 3. Import Dataset in RStudio
To import the dataset, go to the bottom right corner of the screen and click the dataset in your desktop. Left-click the file and select “import dataset”
Step 4. Describe Baseline Demographics
# Variables to summarize (edit these based on your variables)
vars <- c("age", "sex", "weight_kg", "bmi", "alt_baseline", "ast_baseline", "creatinine_baseline")

# Treatment group variable (change the term “rand_arm” based on your dataset)
strata_var <- "rand_arm"

# Create descriptive statistics table
table1 <- CreateTableOne(
  vars = vars,
  strata = strata_var,
  data = data,
  test = TRUE,
  addOverall = TRUE
)

# Format output for kable
tbl_output <- print(
  table1,
  showAllLevels = TRUE,
  quote = FALSE,
  noSpaces = TRUE,
  missing = TRUE,
  printToggle = FALSE
)

kable(tbl_output, caption = "Baseline Characteristics by Treatment Group") %>%
kable_styling(full_width = FALSE, position = "center")This will produce these results in the markdown:
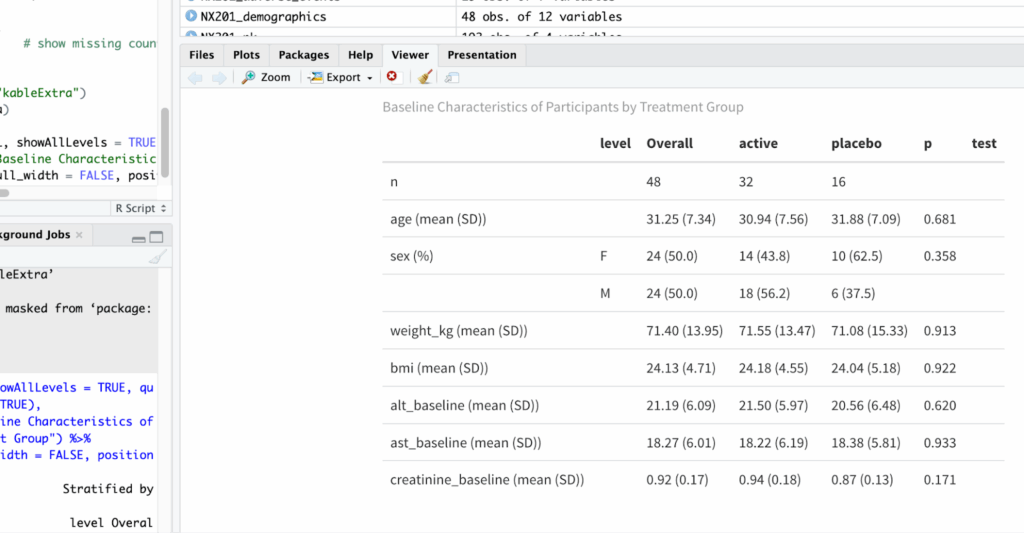
Fig 1. Baseline Characteristics
The p-value for each variable tests whether the baseline characteristics differ between treatment arms.
Sample interpretation: In this sample data, the results show that at baseline, 48 participants were enrolled, with 32 assigned to the active treatment group and 16 to placebo. The mean age was 31.25 years (SD 7.34), and 50% were female. Baseline demographic and clinical characteristics were comparable between groups, with no statistically significant differences in age, sex distribution, weight, BMI, ALT, AST, or creatinine levels (all p > 0.05). These findings indicate successful randomization and balanced baseline characteristics across treatment arms.
Step 4. Describe adverse events
In the next step, descriptive statistics are used to summarize the adverse effects of the investigational drug relative to the control group. No conclusions are drawn at this stage; we simply report and characterize the observed data.
You can customize the code below to fit your dataset and study design. For example, you may choose to display the frequency and percentage of each type of treatment group:
# 3. Summarize by treatment arm
data <- data_full %>%
  group_by(rand_arm) %>%
  summarise(
    total_in_arm = n(),
    n_with_ae = sum(has_ae),
    pct_with_ae = round(100 * n_with_ae / total_in_arm, 1)
  )

# 4. Display table
kable(data,
      caption = "Participants Experiencing ≥1 Adverse Event by Treatment Arm") %>%
kable_styling(full_width = FALSE)This will produce these results in the markdown:
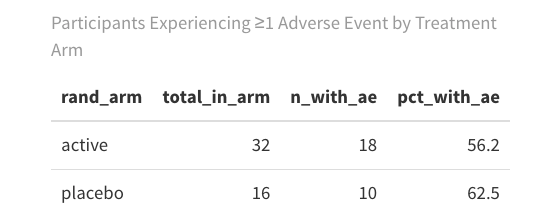
Fig 2. Adverse Events by Treatment Arm
Sample interpretation: The results show that the active group shows a higher AE incidence rate than the placebo group.
Here’s another example where we describe the frequency and percentage of each type of adverse event for each treatment group:
# Frequency and percentage of adverse events by term and treatment arm
data_by_term <- data %>%
  group_by(rand_arm, ae_term) %>%
  summarise(n = n(), .groups = "drop") %>%
  group_by(rand_arm) %>%
  mutate(
    percent = round(100 * n / sum(n), 1)
  ) %>%
  ungroup() %>%
  mutate(summary = paste0(n, " (", percent, "%)")) %>%
  select(rand_arm, ae_term, summary) %>%
  tidyr::pivot_wider(
    names_from = rand_arm,
    values_from = summary,
    values_fill = "0 (0%)"
  )

kable(data_by_term,
      caption = "Frequency and Percentage of Adverse Events by Term and Treatment Arm") %>%
kable_styling(full_width = FALSE)This will produce these results in the markdown:
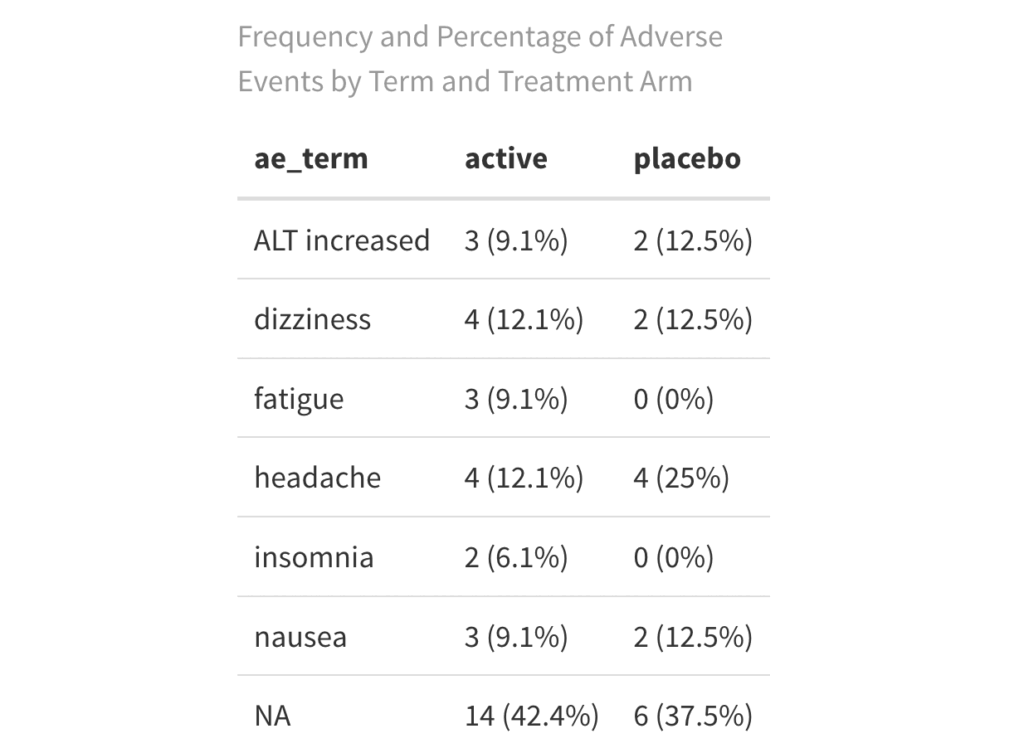
Fig 3. Adverse Events by Type and Treatment Arm
The examples above illustrate simplified approaches to summarizing adverse events. Depending on your study needs, you can expand these tables to include severity, relationship to the study drug, serious adverse events, and events leading to dose modifications or discontinuation.
Step 5. Determine time until first adverse event
In this step, we will use Kaplan-Meier Survival Analysis to estimate and visualize the time-to-event data, where the “event” refers to the onset of adverse effects such as headaches or dizziness that may indicate drug intolerance. This method allows us to compare the time until the first adverse event between treatment groups. We will also use the Chi-Square test to determine whether there are statistically significant differences in the proportion of participants experiencing adverse events across treatment arms.
# Prepare KM data
km_data <- data %>%
  mutate(
    time = ifelse(has_ae == 1, alt_baseline, alt_baseline), # Replace alt_baseline with time-to-event if you have it
    event = has_ae,
    treatment = as.factor(rand_arm)
  )

# Fit Kaplan-Meier
km_fit <- survfit(Surv(time, event) ~ treatment, data = km_data)

# Plot KM curve
ggsurvplot(
  km_fit,
  data = km_data,
  pval = TRUE,                        # log-rank test
  conf.int = TRUE,                    # confidence intervals
  risk.table = TRUE,                  # at-risk table
  legend.labs = c("Active", "Placebo"),
  legend.title = "Treatment Group",
  xlab = "Days",
  ylab = "Probability of No AE",
  title = "Kaplan-Meier: Time to First Adverse Event",
  break.time.by = 5
)This will produce these results in the markdown:
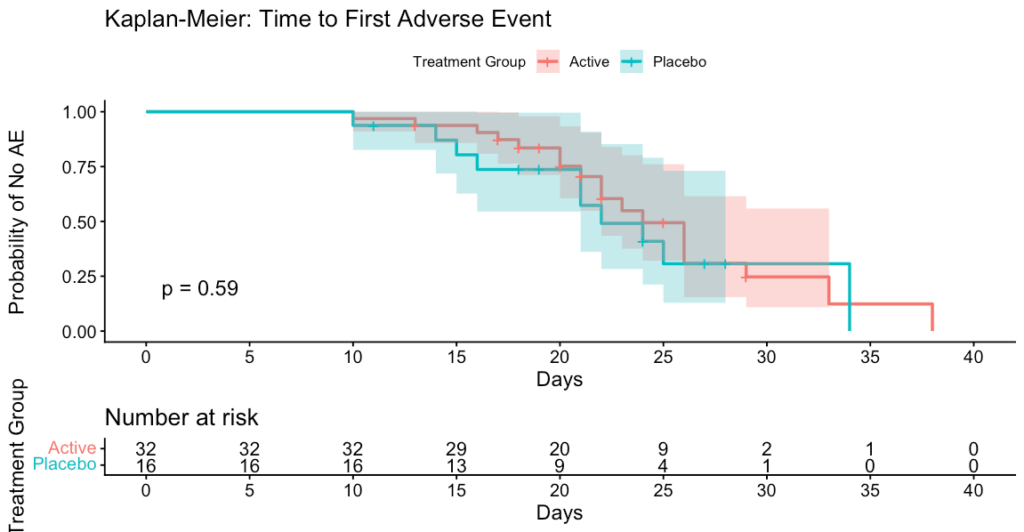
Fig 4. Kaplan-Meier Curve
This Kaplan-Meier curve illustrates the time to first adverse event (AE) for participants in the Active (red) and Placebo (blue) treatment groups. The Y-axis represents the probability of remaining free from any AE, while the X-axis shows time in days since treatment initiation.
Sample interpretation: Participants receiving the Active treatment and those receiving Placebo experienced their first adverse events at similar rates and times. The difference between groups is not statistically significant (p = 0.59), meaning there is no evidence that the Active treatment affects the time to first AE compared to Placebo.
Step 6. Assess the Association Between Treatment and Adverse Events
In addition to the Kaplan-Meier survival analysis, a chi-square test is performed to compare the overall incidence of adverse events between treatment groups. To run the chi-square test, we use this code:
# Create contingency table
table_ae <- table(km_data$treatment, km_data$event)
table_ae

# Run chi-square test
chisq_test <- chisq.test(table_ae)
chisq_testHere’s the sample results:
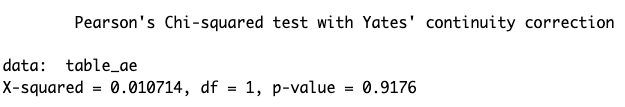
Fig 5. Chi-Square results
The Chi-Square test assesses whether there is a statistically significant association between two categorical variables. In this case, it tests whether the proportion of participants who experienced at least one adverse event differs between treatment groups. A non-significant result (p > 0.05) suggests no evidence of a relationship, meaning any observed difference in adverse event rates is likely due to chance rather than a true effect of the treatment.
At Data2Stats Consultancy Inc., we provide Statistical Consulting for Research to support strong study design and data analysis to generate actionable insights. Our goal is to help you move forward confidently and achieve your research and strategic objectives.