Introduction
A cross-sectional study is a key research method in public health, epidemiology,
and the social sciences. By collecting data from a population at a single point
in time, researchers can determine the prevalence and incidence of diseases,
health behaviors, or other conditions. In this blog, we’ll guide you through the
design and methodology of cross-sectional studies, common data collection
methods, how to implement them in R, and how to analyze the results effectively.
What Is a Cross-Sectional Study?
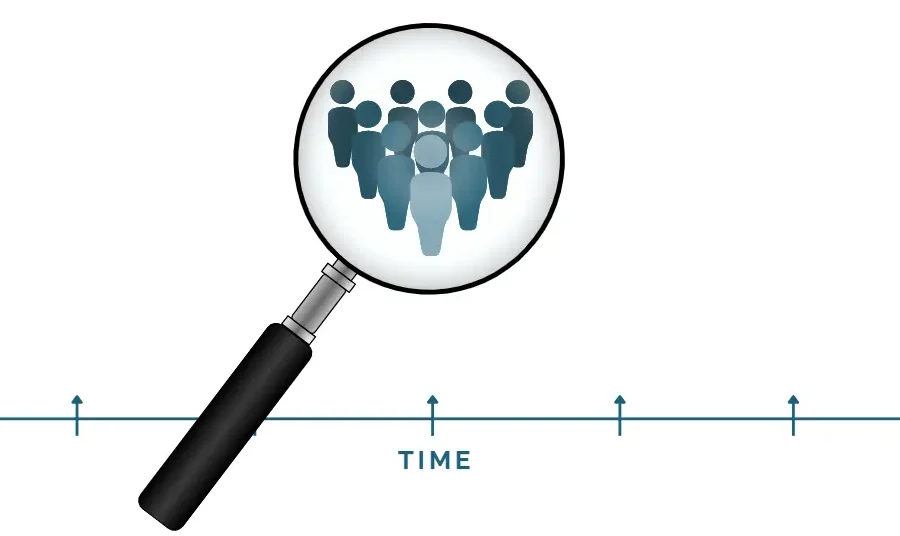
A cross-sectional study gathers data from a defined population at one time
point, providing a “snapshot” of health or behavior patterns. Unlike
longitudinal research, which tracks individuals over time, cross-sectional
designs measure frequency and distribution at a single moment.

Participants and Sampling
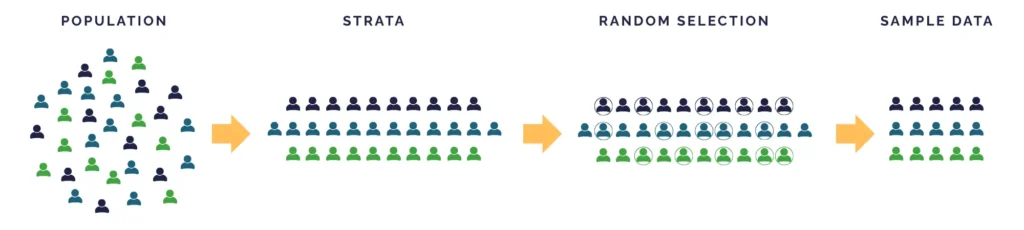
The process begins with identifying a target population. Researchers often use
stratified random sampling to ensure balanced representation across groups like
age, gender, or socioeconomic status. This minimizes bias and strengthens the
study’s findings.
At D2S, our Statistical Consulting for Research ensures that your sampling
strategy is scientifically sound, tailored to your goals, and aligned with
international research standards.
Data Collection Methods
Cross-sectional studies typically use the following methods to gather data:
- Standardized questionnaires and surveys – to capture health, lifestyle, or
behavioral data. - Health screenings and physical exams – to measure objective health outcomes.
- Existing Databases – from census, hospital records, sales data, etc.
To ensure accuracy, it is essential to use calibrated instruments and validated
tools.
Data Analysis
Once data is collected, researchers apply statistical methods to derive
meaningful insights, such as:
- Descriptive statistics to calculate mean, median, proportions, or prevalence
rates - Chi-square tests to assess variable associations
- T-tests or ANOVA to compare group averages
- Logistic regression to predict outcomes
Data2Stats’ Data Analysis service applies advanced statistical models and modern
techniques, helping you uncover insights that go beyond surface-level findings.
Ethical Considerations
In this type of research, Ethical Compliance is critical. Researchers must
always:
- Secure informed consent
- Protect participant confidentiality
- Follow international research standards
How to Perform a Cross-Sectional Analysis
- Define your objective. This guides which variables and
statistical tools to use. - Identify the Population and Sample.
1. Population refers to the full group you want to study.
2. Sample refers to the subset you actually measure. - As mentioned above, Stratified Random Sampling is often used to
ensure that subgroups are properly represented. - Collect the Data. Sources can include surveys, health
screenings, or existing databases. Ensure standardized tools are used for
consistency. - Organize and Clean the Data. Make sure to put the data in a
structured format. You may use tools such as Excel, R, SPSS, or Python.
Also, handle missing values, and check for outliers. - Choose the Right Statistical Tests. Depending on your
objective, select the appropriate analysis. - Interpret and Report the Results. Link findings to your
research question.
💡Note that Cross-sectional studies show associations, and not
causation.
Sample Implementation Using R
In this tutorial, we will determine the prevalence of diabetes among adults in
City X, based on responses from a hypothetical survey of 200 adults. We’ll
walk through: (1) prevalence calculation (with confidence intervals), (2) a
chi-square test for association, and (3) data visualization.
Gender: Male/Female
Diabetes: Yes/No
| Gender | Diabetes Status: YES | Diabetes Status: NO | Total |
| Male | 45 | 55 | 100 |
| Female | 30 | 70 | 100 |
| Total | 75 | 125 | 200 |
Step 1. Open RStudio
Step 2 : Create the dataset in R
data <- matrix(c(45, 55,   # Male: Yes, No
                 30, 70),  # Female: Yes, No
               nrow = 2, byrow = TRUE,
               dimnames = list(Gender = c("Male", "Female"),
                               Diabetes = c("Yes", "No")))


data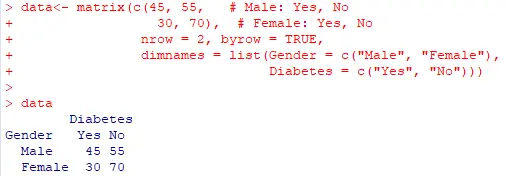
Step 3. Compute prevalence
Overall Prevalence
overall_prev <- sum(data[, "Yes"]) / sum(data)
overall_prev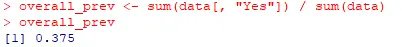
Interpretation: The prevalence of Diabetes in City X is 37.5%.
Prevalence by Gender
male_prev <- data["Male", "Yes"] / sum(data["Male", ])
female_prev <- data["Female", "Yes"] / sum(data["Female", ])


male_prev
female_prev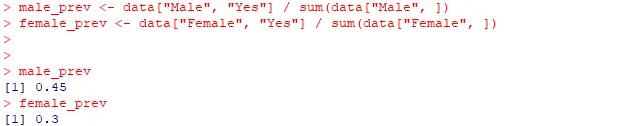
Interpretation: Males (45%) have a higher diabetes prevalence than females
(30%).
Step 4. Using Chi-square Test
chisq_test <- chisq.test(data)
chisq_testThe output includes:
- Chi-square statistic
- Degrees of freedom
- p-value
💡Note: if p < 0.05, diabetes prevalence differs by gender
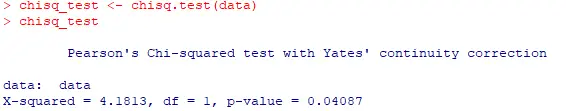
Interpretation: Since p < 0.05, there is a statistically significant
association between gender and diabetes in City X.
Step 5. Data Visualization
barplot(data[, "Yes"] / rowSums(data),
main = "Diabetes Prevalence by Gender",
ylab = "Prevalence",
xlab = "Gender")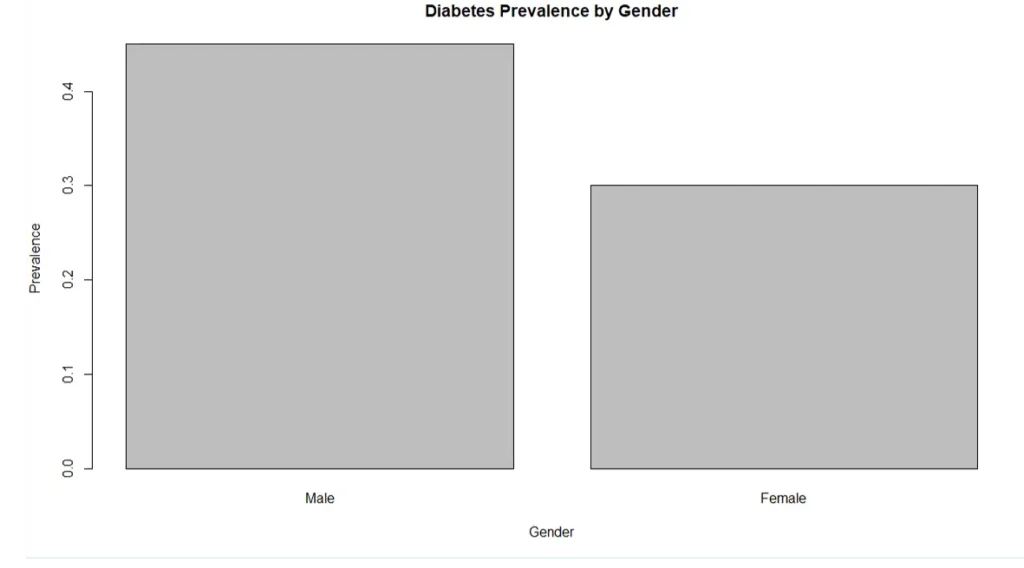
Advantages and Limitations
Cross-sectional studies are cost-efficient and fast to conduct, making them
highly practical. However, because they only measure one point in time, they
cannot establish causality, and can only serve as a basis for further
research.
Conclusion
A cross-sectional study is a powerful way to determine prevalence and
incidence in a population. With the right design, sampling, and analysis, it
produces insights that drive evidence-based decisions.
At Data2Stats Consultancy Inc., we combine Statistical Consulting for Research
and Data Analysis to ensure your study is methodologically sound, data-driven,
and impactful.