
Introduction
Assessing the efficacy of a medical approach or intervention, such as a newly developed drug, surgical procedure, or medical device, is necessary to warrant patient benefits from simply improving symptom relief to reducing mortality rate. The analysis of treatment effects is used for safety evaluation to secure regulatory approval for market distribution and widespread use and determine if a new treatment is better than the existing one. It serves as guidance to healthcare providers in making data-driven decisions and producing evidence-based solutions for screening, diagnosing, or preventing diseases.
Treatment effect is measured by administering the medication to selected study samples and analyzing its outcome. In clinical trials, the standard statistical design widely used is Randomized Controlled Trial (RCT) where participants are randomly assigned to either an experimental group or controlled group to compare differences in outcomes and if better results can be attributed to the intervention. We can simply implement RCT data analysis through Python programming using appropriate statistical methods. In this tutorial, readers will learn how to assess treatment effects using RCT and perform t-test analysis in Python through a step-by-step guide with sample implementation.
Randomized Controlled Trial
A Randomized Controlled Trial (RCT) is a research design that equally divides the sample into two exclusive groups: treatment and control, using a randomization technique. The treatment group receives the experimental approach, while the control group receives a placebo or existing standard treatment. It then measures the difference in outcomes between these groups with the help of relevant statistical tools to assess if the treatment group manifests more favorable results.
Randomization is the core principle of RCT to minimize bias such as confounding and selection biases. Random sampling discredits confounding variables like demographic and clinical factors and ensures that these factors are roughly equally distributed across groups by chance, so the observed difference in outcomes is likely due to the treatment itself rather than these pre-existing external factors. This method of random assignment also eliminates the tendency of the researcher to influence the selection process and gives each participant an even probability of being assigned to either group.
Examples RCT in epidemiology include testing the efficacy of a new weight loss drug or medicine for reducing severity of migraine, investigating whether a new method of physical therapy prevents a particular type of injury, and assessing the relationship between diet and risk of acquiring a disease.
RCT Framework
The diagram below illustrates the workflow and key components of RCT – population and sample selection, random assignment, treatment vs. control, and outcome measurement.
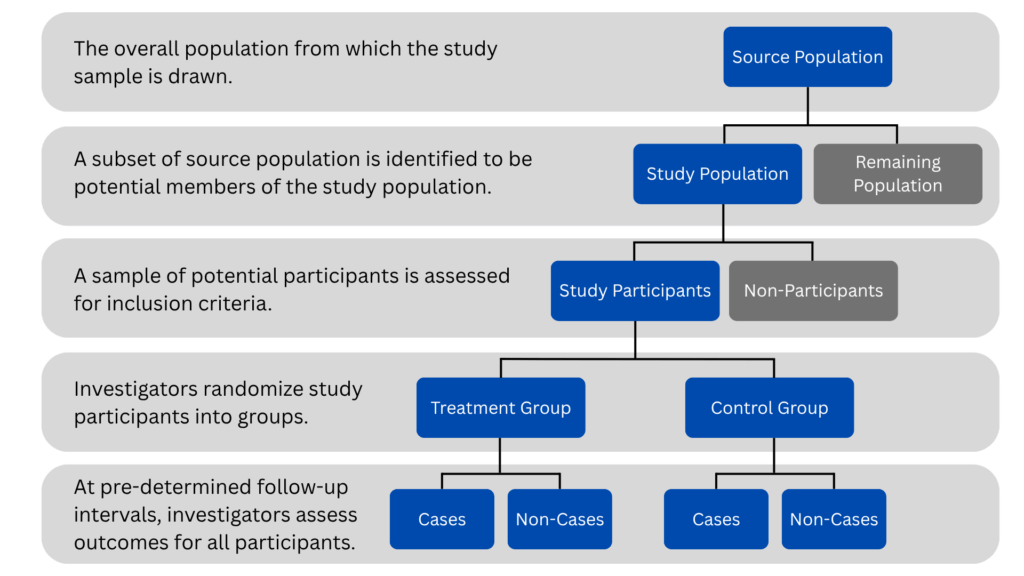
Fig. 1. RCT Framework
t-Test Analysis
A t-test is a type of inferential statistics used to determine if two population means significantly differ from each other. In clinical trials, t-test can be used to test the hypothesis that the intervention has an actual effect on the subjects.
The following hypotheses are what we are trying to test in every study:
- Null Hypothesis: There is no difference between treatment and control means.
- Alternative Hypothesis: There is a significant difference between the means (treatment effect is present).
Hypothetical Scenario
Suppose a medical researcher aims to evaluate if a newly formulated drug for lowering high blood pressure is effective by conducting RCT. Twenty patients were randomly assigned to either treatment or control group – ten patients received the new drug, while the rest were given a placebo. Their systolic blood pressures are measured before and after the treatment and recorded in Table 1.
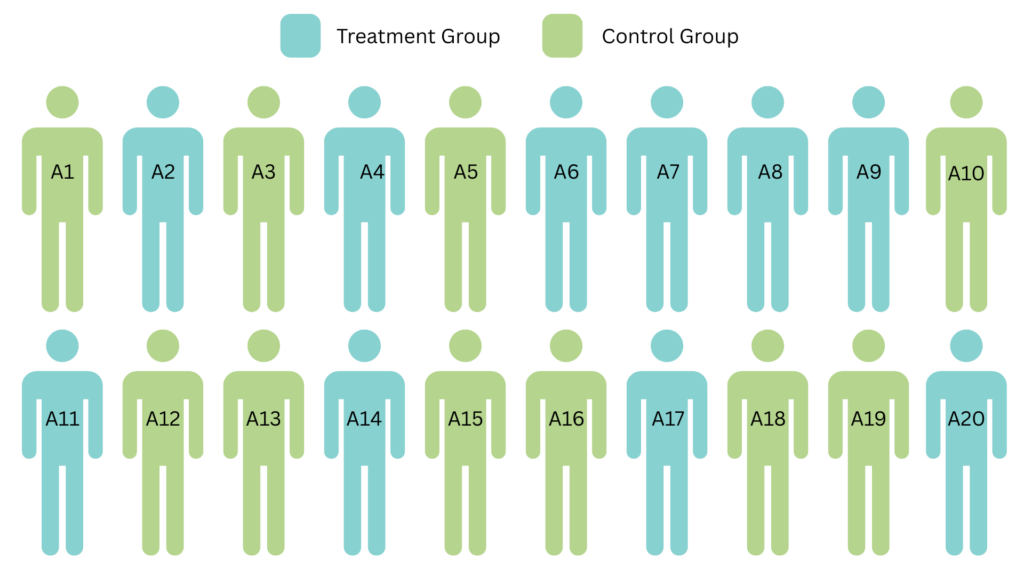
Fig. 2. Random Assignment of 20 Individuals
Table 1. Systolic Blood Pressures of 20 Patients
| Patient ID | Group | Pre-Treatment | Post-Treatment |
| A1 | control | 152 | 150 |
| A2 | treatment | 148 | 136 |
| A3 | control | 160 | 155 |
| A4 | treatment | 150 | 139 |
| A5 | control | 145 | 142 |
| A6 | treatment | 155 | 144 |
| A7 | treatment | 149 | 138 |
| A8 | treatment | 151 | 140 |
| A9 | treatment | 157 | 146 |
| A10 | control | 163 | 159 |
| A11 | treatment | 150 | 141 |
| A12 | control | 147 | 144 |
| A13 | control | 154 | 151 |
| A14 | treatment | 149 | 140 |
| A15 | control | 158 | 156 |
| A16 | control | 151 | 149 |
| A17 | treatment | 153 | 143 |
| A18 | control | 150 | 147 |
| A19 | control | 155 | 152 |
| A20 | treatment | 152 | 142 |
Hypotheses:
- Null Hypothesis: There is no difference between the means of changes in systolic blood pressures of the two groups.
- Alternative Hypothesis: There is a significant difference between the means of changes in systolic blood pressures of the two groups.
Sample Analysis in Python
Step 1. Open Google Colab and add a new notebook.
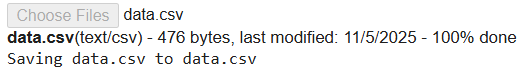
Step 2: Paste and run the code below to upload the CSV file containing your dataset from your local device. If your file has a different name, update the file name in the code accordingly.
# --- Upload the CSV file ---
from google.colab import files
import pandas as pd
from scipy import stats


# Prompt file upload
uploaded = files.upload()


# Load the uploaded CSV (assuming the file name is data.csv)
df = pd.read_csv("data.csv")
Result:
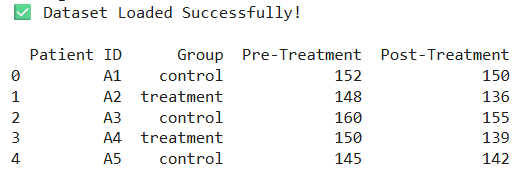
Step 3: Preview dataset.
# --- Preview dataset ---
print("✅ Dataset Loaded Successfully!\n")
print(df.head(), "\n")
Result:
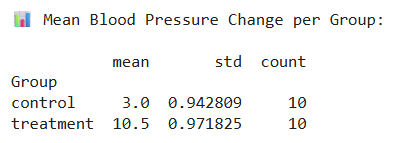
Step 4: Compute the mean difference between the systolic blood pressures before and after the patients receive the treatment per group.
# --- Compute mean changes ---
df['BP_Change'] = df['Pre-Treatment'] - df['Post-Treatment']


group_summary = df.groupby('Group')['BP_Change'].agg(['mean', 'std', 'count'])
print("📊 Mean Blood Pressure Change per Group:\n")
print(group_summary, "\n")
Result:
Step 5: Separate the dataset into two groups by extracting each group’s post-treatment blood pressure values for statistical comparison.
# --- Separate data by group ---
treatment = df[df['Group'].str.lower() == 'treatment']['Post-Treatment']
control = df[df['Group'].str.lower() == 'control']['Post-Treatment']
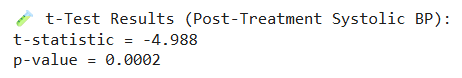
Step 6: Perform an independent samples t-test analysis.
# --- Conduct independent samples t-test ---
t_stat, p_value = stats.ttest_ind(treatment, control, equal_var=False)


print("🧪 t-Test Results (Post-Treatment Systolic BP):")
print(f"t-statistic = {t_stat:.3f}")
print(f"p-value = {p_value:.4f}\n")
Result:
Step 7: Interpret results.
# --- Interpret results ---
alpha = 0.05
if p_value < alpha:
    print("✅ Result: Significant difference between treatment and control groups.")
else:
    print("⚪ Result: No significant difference detected between groups.")
Result: p-value < 0.05. There is enough evidence to reject the null hypothesis. The new drug for lowering high blood pressure is effective.

Limitations and Considerations
Despite the strengths of RCT in terms of minimizing bias, it also has disadvantages for some scenarios. RCT requires intensive time and cost in data collection. It takes a long period to complete. Another concern is that the chosen participants may not represent the whole population. The treatment effect might be positive for the participants, but that might not be true to the general population. Also, due to the long duration of the experiment, some participants at any point become unreachable and this may lead to unreliable results.
Assumptions of t-test about the data include independence of individual observations, normal distribution, and equal variances between groups (homogeneity). If one assumption is violated, consider a nonparametric alternative. It is also important to note that t-test only works for continuous data, not categorical outcomes.
Conclusion
Randomized controlled trial (RCT) is considered one of the most robust designs used in studies assessing treatment efficacy. Like any research approach, RCT has its own pros and cons. Despite its advantage in randomization, implementing RCT tends to be time consuming and costly. In clinical trials, RCT, along with necessary statistical tools such as t-test, can be used in evaluating whether the new medical intervention is better than the existing standard. Ultimately, this approach supports evidence-based decision-making in healthcare.At Data2Stats, we assist medical professionals and researchers through our comprehensive statistical consulting and data analysis services. Our expertise spans the entire research process – from refining study design and cleaning data to performing analyses, interpreting results, and preparing manuscripts for publication.